Comprehensive diagnostics API for thread pool monitoring. More...
#include <thread_pool_diagnostics.h>
Public Member Functions | |
| thread_pool_diagnostics (thread_pool &pool, const diagnostics_config &config={}) | |
| Constructs diagnostics for a thread pool. | |
| ~thread_pool_diagnostics () | |
| Destructor. | |
| thread_pool_diagnostics (const thread_pool_diagnostics &)=delete | |
| thread_pool_diagnostics & | operator= (const thread_pool_diagnostics &)=delete |
| thread_pool_diagnostics (thread_pool_diagnostics &&)=delete | |
| thread_pool_diagnostics & | operator= (thread_pool_diagnostics &&)=delete |
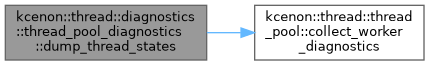
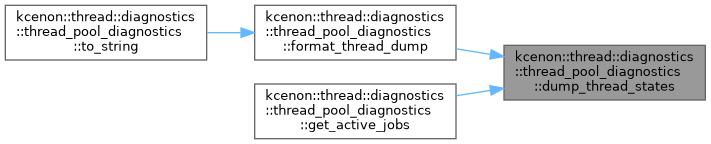
| auto | dump_thread_states () const -> std::vector< thread_info > |
| Gets current state of all worker threads. | |
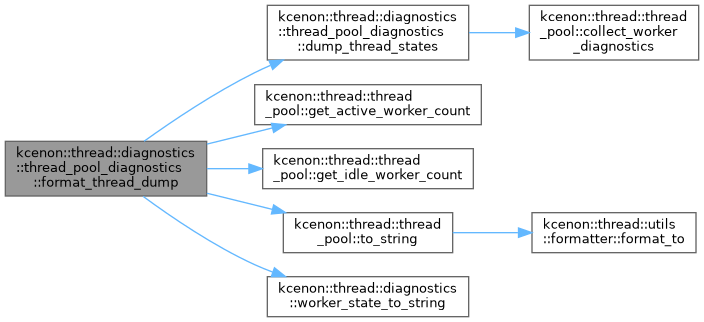
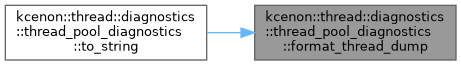
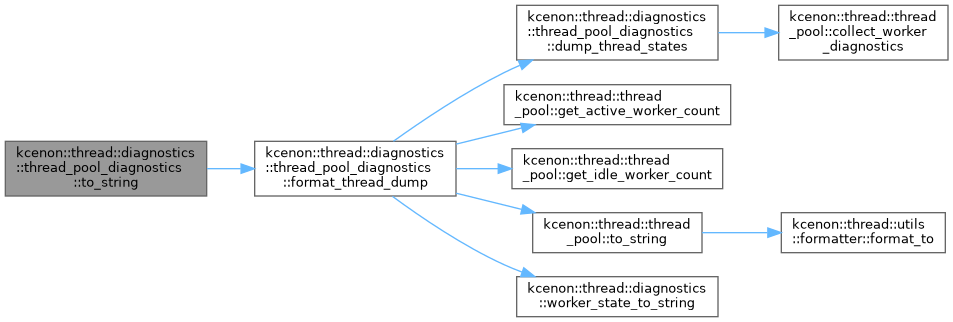
| auto | format_thread_dump () const -> std::string |
| Gets formatted thread dump (human-readable). | |
| auto | get_active_jobs () const -> std::vector< job_info > |
| Gets currently executing jobs. | |
| auto | get_pending_jobs (std::size_t limit=100) const -> std::vector< job_info > |
| Gets pending jobs in queue. | |
| auto | get_recent_jobs (std::size_t limit=100) const -> std::vector< job_info > |
| Gets recent completed/failed jobs. | |
| void | record_job_completion (const job_info &info) |
| Records a job completion for history tracking. | |
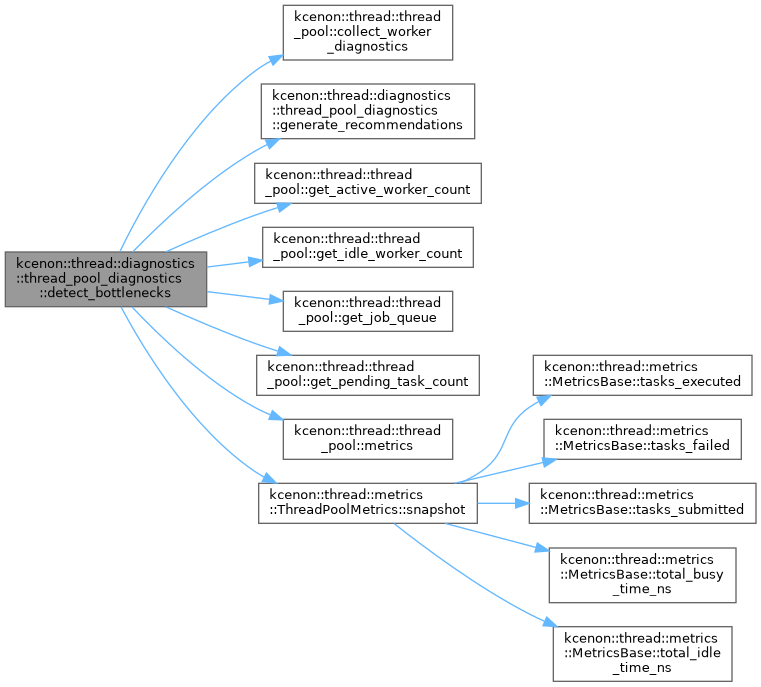
| auto | detect_bottlenecks () const -> bottleneck_report |
| Analyzes for bottlenecks. | |
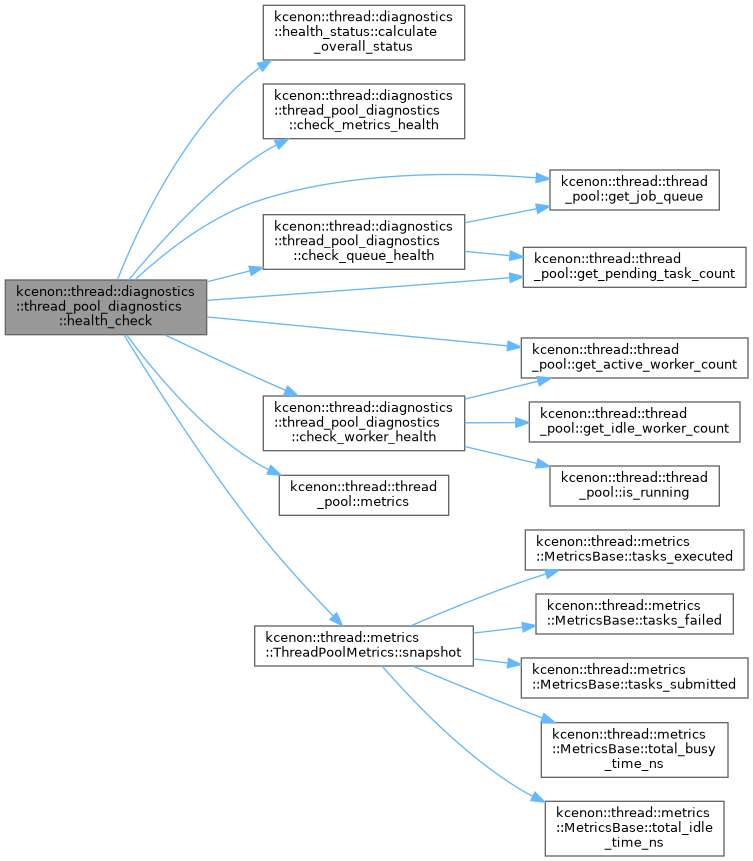
| auto | health_check () const -> health_status |
| Performs comprehensive health check. | |
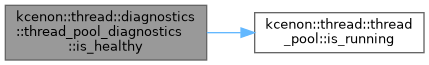
| auto | is_healthy () const -> bool |
| Quick check if pool is healthy. | |
| void | enable_tracing (bool enable, std::size_t history_size=1000) |
| Enables or disables job execution tracing. | |
| auto | is_tracing_enabled () const -> bool |
| Checks if tracing is enabled. | |
| void | add_event_listener (std::shared_ptr< execution_event_listener > listener) |
| Adds an event listener. | |
| void | remove_event_listener (std::shared_ptr< execution_event_listener > listener) |
| Removes an event listener. | |
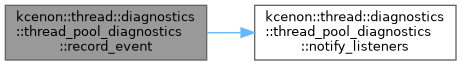
| void | record_event (const job_execution_event &event) |
| Records a job execution event. | |
| auto | get_recent_events (std::size_t limit=100) const -> std::vector< job_execution_event > |
| Gets recent execution events. | |
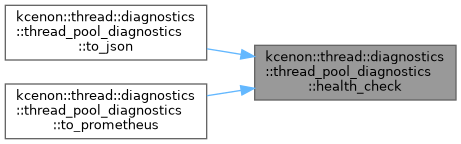
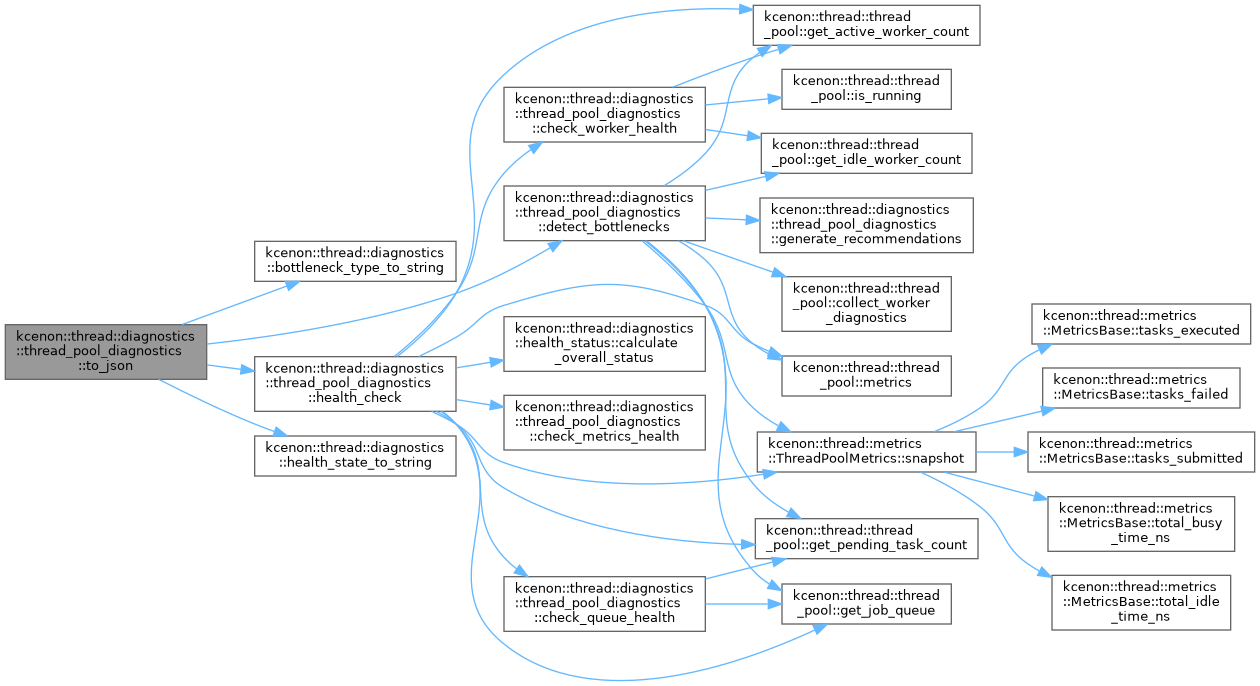
| auto | to_json () const -> std::string |
| Exports diagnostics as JSON. | |
| auto | to_string () const -> std::string |
| Exports diagnostics as formatted string. | |
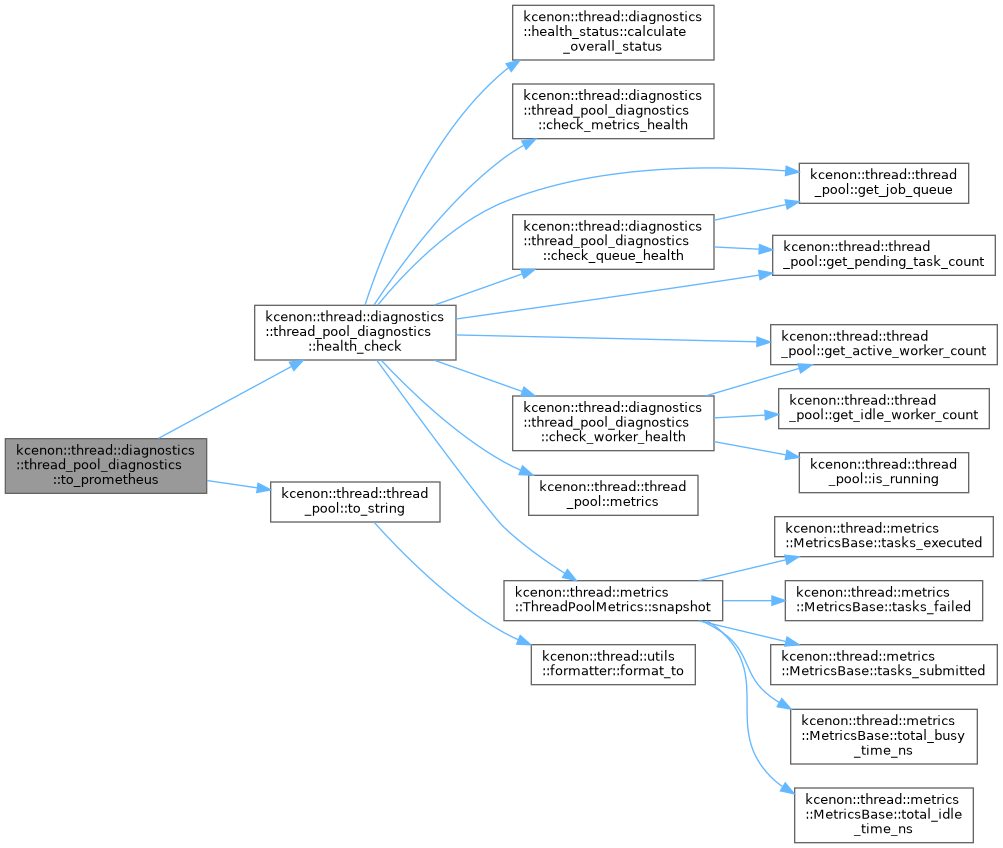
| auto | to_prometheus () const -> std::string |
| Exports diagnostics as Prometheus-compatible metrics. | |
| auto | get_config () const -> diagnostics_config |
| Gets the current configuration. | |
| void | set_config (const diagnostics_config &config) |
| Updates the configuration. | |
Private Member Functions | |
| auto | get_worker_info (const thread_worker &worker, std::size_t index) const -> thread_info |
| Gets thread info for a single worker. | |
| void | notify_listeners (const job_execution_event &event) |
| Notifies all event listeners. | |
| void | generate_recommendations (bottleneck_report &report) const |
| Generates recommendations for a bottleneck. | |
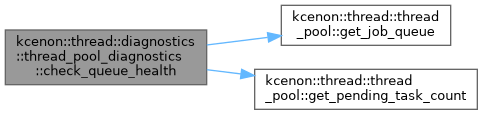
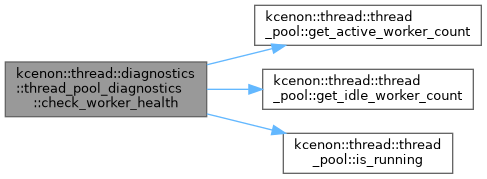
| auto | check_worker_health () const -> component_health |
| Checks worker component health. | |
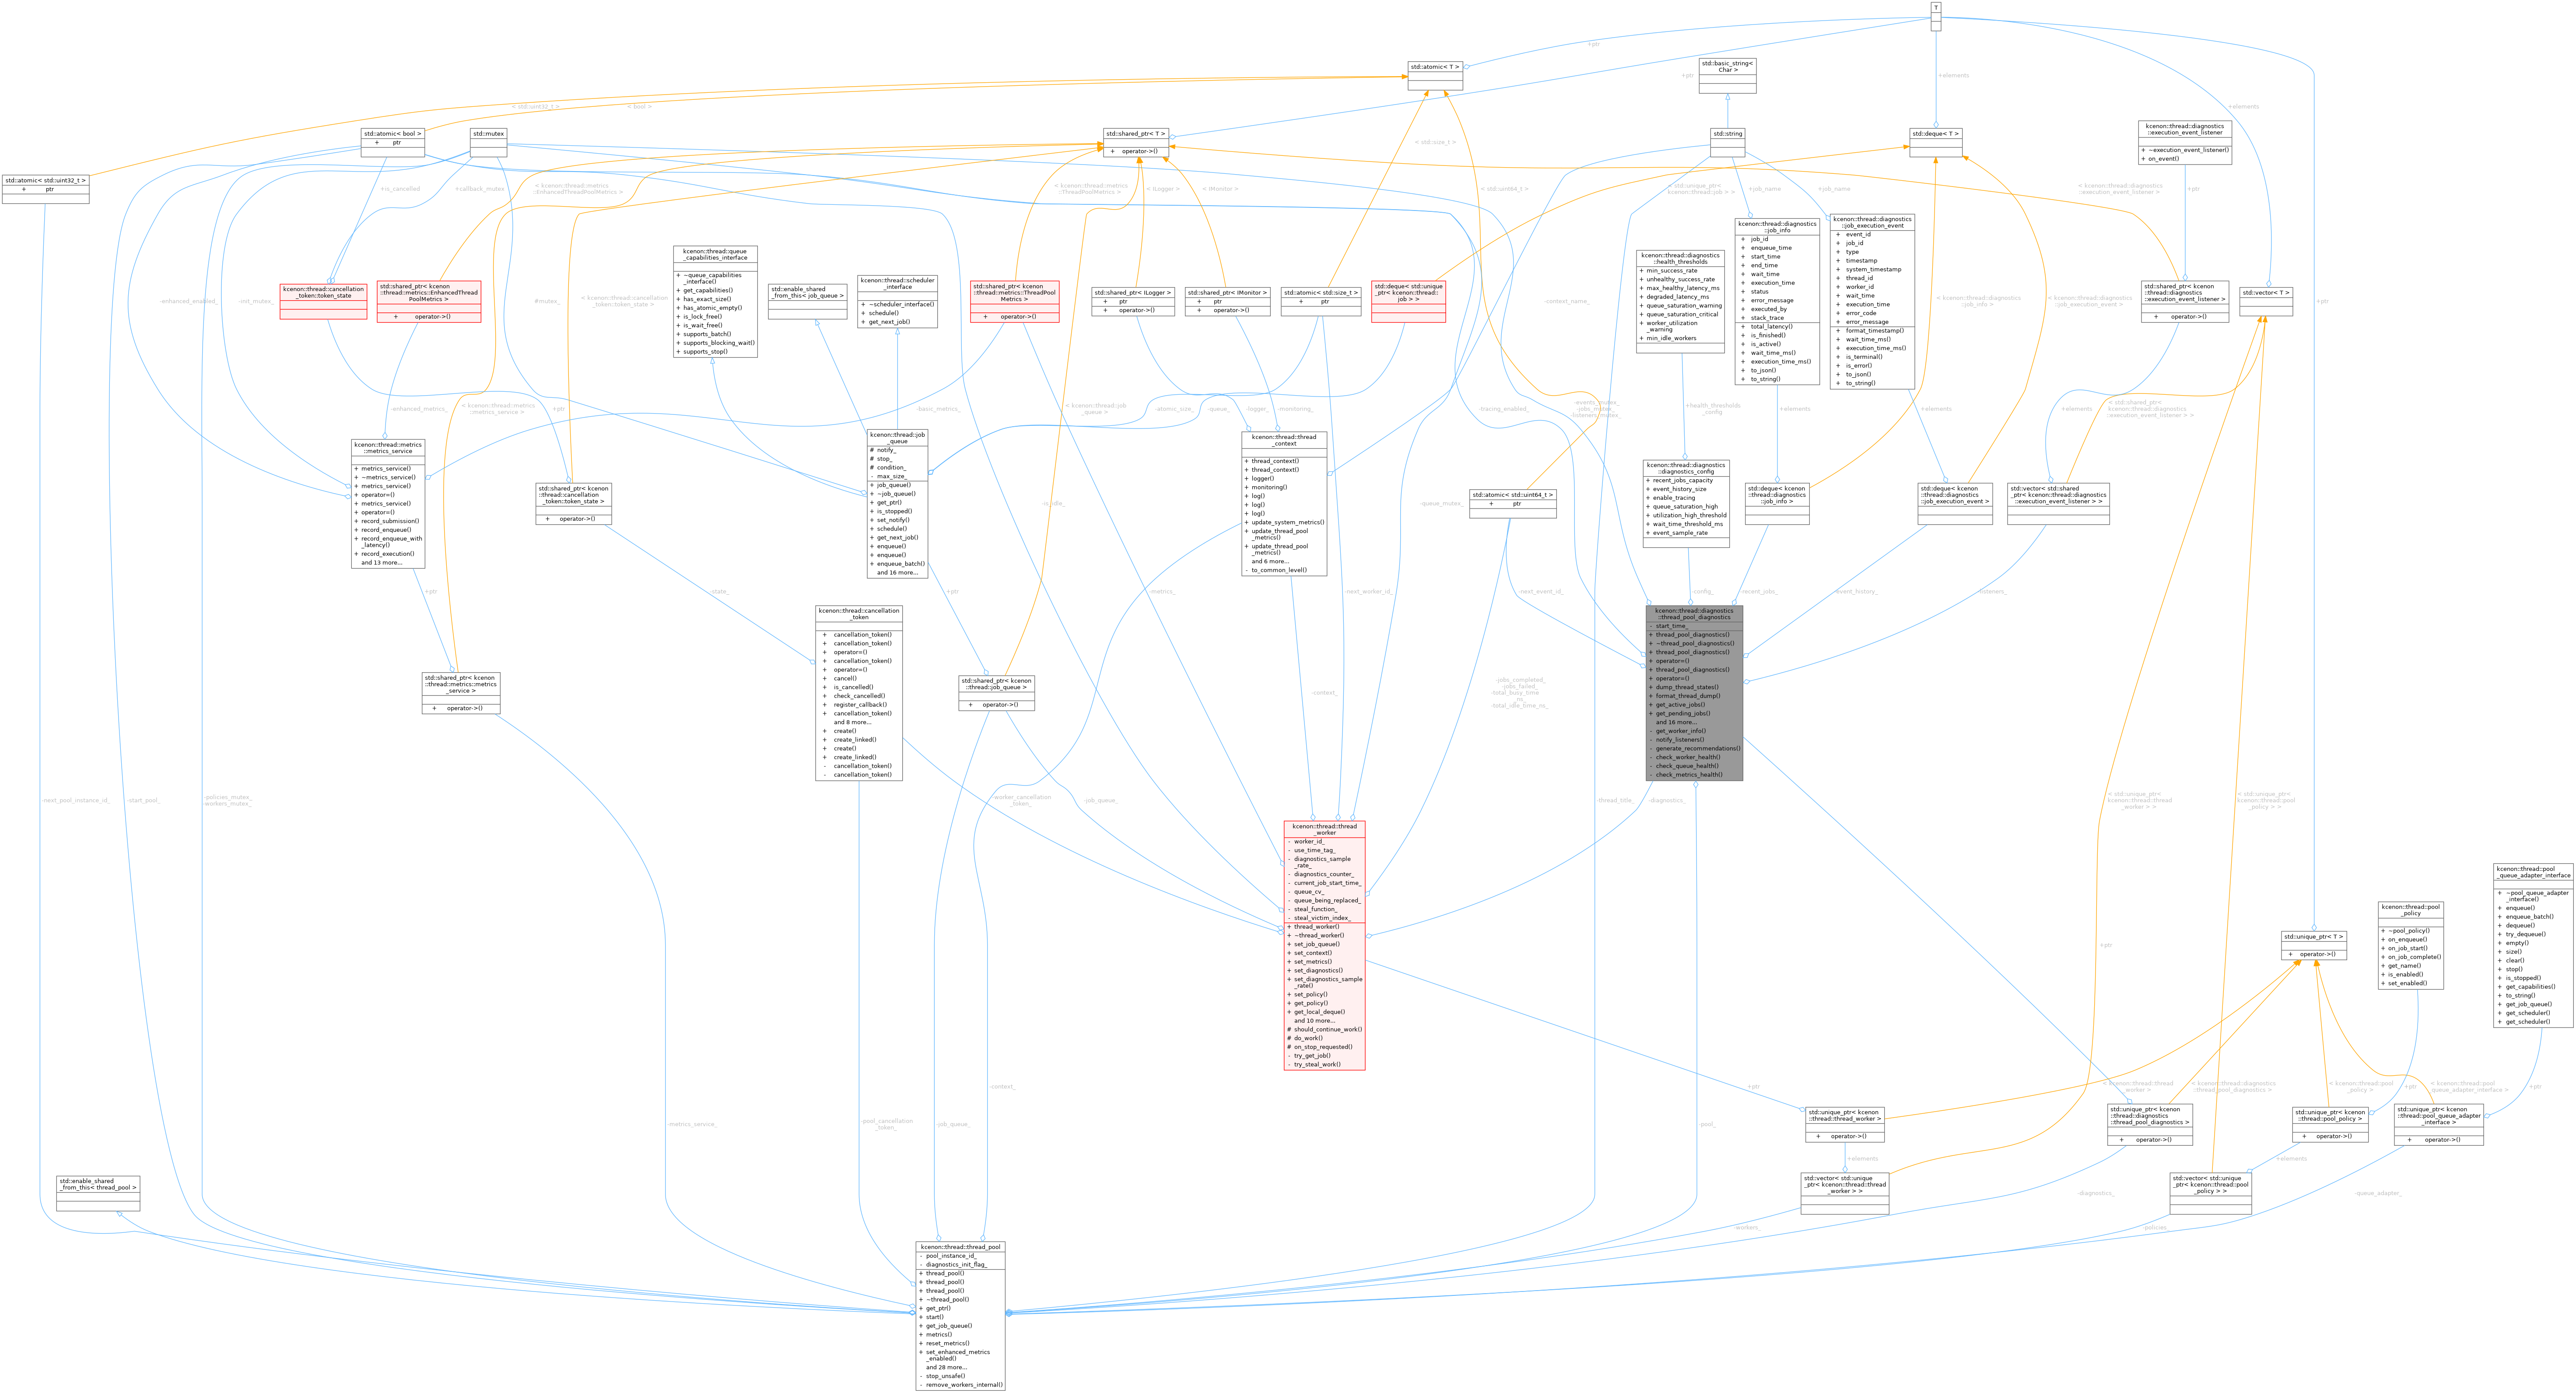
| auto | check_queue_health () const -> component_health |
| Checks queue component health. | |
| auto | check_metrics_health (double avg_latency_ms, double success_rate) const -> component_health |
| Checks metrics component health. | |
Private Attributes | |
| thread_pool & | pool_ |
| Reference to the monitored thread pool. | |
| diagnostics_config | config_ |
| Configuration for diagnostics. | |
| std::atomic< bool > | tracing_enabled_ {false} |
| Whether event tracing is enabled. | |
| std::mutex | events_mutex_ |
| Mutex for event history access. | |
| std::deque< job_execution_event > | event_history_ |
| Ring buffer for event history. | |
| std::mutex | jobs_mutex_ |
| Mutex for recent jobs access. | |
| std::deque< job_info > | recent_jobs_ |
| Ring buffer for recent job completions. | |
| std::mutex | listeners_mutex_ |
| Mutex for event listeners. | |
| std::vector< std::shared_ptr< execution_event_listener > > | listeners_ |
| Event listeners. | |
| std::atomic< std::uint64_t > | next_event_id_ {0} |
| Counter for event IDs. | |
| std::chrono::steady_clock::time_point | start_time_ |
| Time when the pool was started. | |
Detailed Description
Comprehensive diagnostics API for thread pool monitoring.
Provides thread dump capabilities, job tracing, bottleneck detection, and health check integration for thread pools.
Design Principles
- Non-intrusive: Minimal overhead when not actively used
- Thread-safe: All methods can be called from any thread
- Read-only: Never modifies thread pool state
- Snapshot-based: Returns point-in-time snapshots
Thread Safety
All public methods are thread-safe and can be called concurrently. Internal state is protected by appropriate synchronization.
Performance Considerations
- Thread dump: O(n) where n is worker count
- Job inspection: O(1) for active jobs, O(n) for history
- Bottleneck detection: O(n) where n is worker count
- Health check: O(n) including all component checks
- Event tracing: < 1μs overhead per event when enabled
Usage Example
Definition at line 142 of file thread_pool_diagnostics.h.
Constructor & Destructor Documentation
◆ thread_pool_diagnostics() [1/3]
|
explicit |
Constructs diagnostics for a thread pool.
- Parameters
-
pool Reference to the thread pool to diagnose. config Optional configuration for diagnostics.
Definition at line 21 of file thread_pool_diagnostics.cpp.
◆ ~thread_pool_diagnostics()
|
default |
Destructor.
◆ thread_pool_diagnostics() [2/3]
|
delete |
◆ thread_pool_diagnostics() [3/3]
|
delete |
Member Function Documentation
◆ add_event_listener()
| void kcenon::thread::diagnostics::thread_pool_diagnostics::add_event_listener | ( | std::shared_ptr< execution_event_listener > | listener | ) |
Adds an event listener.
- Parameters
-
listener Listener to add.
Definition at line 620 of file thread_pool_diagnostics.cpp.
References listeners_, and listeners_mutex_.
◆ check_metrics_health()
|
nodiscardprivate |
Checks metrics component health.
- Parameters
-
avg_latency_ms Current average latency. success_rate Current success rate.
- Returns
- Component health status for metrics.
Definition at line 546 of file thread_pool_diagnostics.cpp.
References kcenon::thread::diagnostics::degraded, kcenon::thread::diagnostics::component_health::details, kcenon::thread::diagnostics::healthy, kcenon::thread::diagnostics::component_health::message, kcenon::thread::diagnostics::component_health::name, kcenon::thread::diagnostics::component_health::state, and kcenon::thread::diagnostics::unhealthy.
Referenced by health_check().

◆ check_queue_health()
|
nodiscardprivate |
Checks queue component health.
- Returns
- Component health status for queue.
Definition at line 491 of file thread_pool_diagnostics.cpp.
References config_, kcenon::thread::diagnostics::degraded, kcenon::thread::diagnostics::component_health::details, kcenon::thread::thread_pool::get_job_queue(), kcenon::thread::thread_pool::get_pending_task_count(), kcenon::thread::diagnostics::diagnostics_config::health_thresholds_config, kcenon::thread::diagnostics::healthy, kcenon::thread::diagnostics::component_health::message, kcenon::thread::diagnostics::component_health::name, pool_, kcenon::thread::diagnostics::component_health::state, and kcenon::thread::diagnostics::unhealthy.
Referenced by health_check().

◆ check_worker_health()
|
nodiscardprivate |
Checks worker component health.
- Returns
- Component health status for workers.
Definition at line 450 of file thread_pool_diagnostics.cpp.
References kcenon::thread::diagnostics::active, kcenon::thread::diagnostics::degraded, kcenon::thread::diagnostics::component_health::details, kcenon::thread::thread_pool::get_active_worker_count(), kcenon::thread::thread_pool::get_idle_worker_count(), kcenon::thread::diagnostics::healthy, kcenon::thread::diagnostics::idle, kcenon::thread::thread_pool::is_running(), kcenon::thread::diagnostics::component_health::message, kcenon::thread::diagnostics::component_health::name, pool_, kcenon::thread::diagnostics::component_health::state, kcenon::thread::diagnostics::unhealthy, kcenon::thread::thread_pool::workers_, and kcenon::thread::thread_pool::workers_mutex_.
Referenced by health_check().
◆ detect_bottlenecks()
|
nodiscard |
Analyzes for bottlenecks.
- Returns
- Bottleneck analysis report.
Definition at line 161 of file thread_pool_diagnostics.cpp.
References kcenon::thread::diagnostics::bottleneck_report::avg_wait_time_ms, kcenon::thread::thread_pool::collect_worker_diagnostics(), config_, kcenon::thread::diagnostics::bottleneck_report::description, kcenon::thread::diagnostics::bottleneck_report::estimated_backlog_time_ms, generate_recommendations(), kcenon::thread::thread_pool::get_active_worker_count(), kcenon::thread::thread_pool::get_idle_worker_count(), kcenon::thread::thread_pool::get_job_queue(), kcenon::thread::thread_pool::get_pending_task_count(), kcenon::thread::diagnostics::bottleneck_report::has_bottleneck, kcenon::thread::diagnostics::bottleneck_report::idle_workers, kcenon::thread::diagnostics::bottleneck_report::jobs_rejected, kcenon::thread::diagnostics::lock_contention, kcenon::thread::diagnostics::memory_pressure, kcenon::thread::thread_pool::metrics(), pool_, kcenon::thread::diagnostics::bottleneck_report::queue_depth, kcenon::thread::queue_depth, kcenon::thread::diagnostics::queue_full, kcenon::thread::diagnostics::bottleneck_report::queue_saturation, kcenon::thread::diagnostics::slow_consumer, kcenon::thread::metrics::ThreadPoolMetrics::snapshot(), kcenon::thread::diagnostics::bottleneck_report::total_workers, kcenon::thread::diagnostics::bottleneck_report::type, kcenon::thread::diagnostics::uneven_distribution, kcenon::thread::diagnostics::diagnostics_config::utilization_high_threshold, kcenon::thread::diagnostics::bottleneck_report::utilization_variance, kcenon::thread::diagnostics::diagnostics_config::wait_time_threshold_ms, kcenon::thread::diagnostics::worker_starvation, kcenon::thread::diagnostics::bottleneck_report::worker_utilization, kcenon::thread::thread_pool::workers_, and kcenon::thread::thread_pool::workers_mutex_.
Referenced by to_json().

◆ dump_thread_states()
|
nodiscard |
Gets current state of all worker threads.
- Returns
- Vector of thread information.
Thread-safe: Can be called from any thread.
Definition at line 36 of file thread_pool_diagnostics.cpp.
References kcenon::thread::thread_pool::collect_worker_diagnostics(), and pool_.
Referenced by format_thread_dump(), and get_active_jobs().
◆ enable_tracing()
| void kcenon::thread::diagnostics::thread_pool_diagnostics::enable_tracing | ( | bool | enable, |
| std::size_t | history_size = 1000 ) |
Enables or disables job execution tracing.
- Parameters
-
enable Enable or disable tracing. history_size Number of events to retain.
Definition at line 596 of file thread_pool_diagnostics.cpp.
References config_, kcenon::thread::diagnostics::diagnostics_config::enable_tracing, event_history_, kcenon::thread::diagnostics::diagnostics_config::event_history_size, events_mutex_, and tracing_enabled_.
◆ format_thread_dump()
|
nodiscard |
Gets formatted thread dump (human-readable).
- Returns
- Multi-line string with thread dump.
Output format:
Definition at line 42 of file thread_pool_diagnostics.cpp.
References dump_thread_states(), kcenon::thread::thread_pool::get_active_worker_count(), kcenon::thread::thread_pool::get_idle_worker_count(), pool_, kcenon::thread::thread_pool::to_string(), kcenon::thread::diagnostics::worker_state_to_string(), kcenon::thread::thread_pool::workers_, and kcenon::thread::thread_pool::workers_mutex_.
Referenced by to_string().
◆ generate_recommendations()
|
private |
Generates recommendations for a bottleneck.
- Parameters
-
report The bottleneck report to add recommendations to.
Definition at line 331 of file thread_pool_diagnostics.cpp.
References kcenon::thread::diagnostics::lock_contention, kcenon::thread::diagnostics::memory_pressure, kcenon::thread::diagnostics::none, kcenon::thread::diagnostics::queue_full, kcenon::thread::diagnostics::bottleneck_report::recommendations, kcenon::thread::diagnostics::slow_consumer, kcenon::thread::diagnostics::bottleneck_report::type, kcenon::thread::diagnostics::uneven_distribution, and kcenon::thread::diagnostics::worker_starvation.
Referenced by detect_bottlenecks().

◆ get_active_jobs()
|
nodiscard |
Gets currently executing jobs.
- Returns
- Vector of active job information.
Definition at line 97 of file thread_pool_diagnostics.cpp.
References dump_thread_states().

◆ get_config()
|
nodiscard |
Gets the current configuration.
- Returns
- Current diagnostics configuration.
Definition at line 758 of file thread_pool_diagnostics.cpp.
References config_.
◆ get_pending_jobs()
|
nodiscard |
Gets pending jobs in queue.
- Parameters
-
limit Maximum number to return (0 = all).
- Returns
- Vector of pending job information.
Definition at line 115 of file thread_pool_diagnostics.cpp.
◆ get_recent_events()
|
nodiscard |
Gets recent execution events.
- Parameters
-
limit Maximum events to return.
- Returns
- Vector of recent events.
Definition at line 680 of file thread_pool_diagnostics.cpp.
◆ get_recent_jobs()
|
nodiscard |
Gets recent completed/failed jobs.
- Parameters
-
limit Maximum number to return.
- Returns
- Vector of recent job information.
Definition at line 128 of file thread_pool_diagnostics.cpp.
◆ get_worker_info()
|
nodiscardprivate |
Gets thread info for a single worker.
- Parameters
-
worker The worker to query. index Worker index in the pool.
- Returns
- Thread information.
Definition at line 769 of file thread_pool_diagnostics.cpp.
References kcenon::thread::diagnostics::active, kcenon::thread::diagnostics::idle, kcenon::thread::info, and kcenon::thread::diagnostics::thread_info::worker_id.
◆ health_check()
|
nodiscard |
Performs comprehensive health check.
- Returns
- Health status with all component states.
Definition at line 383 of file thread_pool_diagnostics.cpp.
References kcenon::thread::diagnostics::health_status::active_workers, kcenon::thread::diagnostics::health_status::avg_latency_ms, kcenon::thread::diagnostics::health_status::calculate_overall_status(), check_metrics_health(), check_queue_health(), kcenon::thread::diagnostics::health_status::check_time, check_worker_health(), kcenon::thread::diagnostics::health_status::components, kcenon::thread::thread_pool::get_active_worker_count(), kcenon::thread::thread_pool::get_job_queue(), kcenon::thread::thread_pool::get_pending_task_count(), kcenon::thread::thread_pool::metrics(), pool_, kcenon::thread::diagnostics::health_status::queue_capacity, kcenon::thread::diagnostics::health_status::queue_depth, kcenon::thread::metrics::ThreadPoolMetrics::snapshot(), start_time_, kcenon::thread::diagnostics::health_status::success_rate, kcenon::thread::diagnostics::health_status::total_jobs_processed, kcenon::thread::diagnostics::health_status::total_workers, kcenon::thread::diagnostics::health_status::uptime_seconds, kcenon::thread::thread_pool::workers_, and kcenon::thread::thread_pool::workers_mutex_.
Referenced by to_json(), and to_prometheus().
◆ is_healthy()
|
nodiscard |
Quick check if pool is healthy.
- Returns
- true if pool is operational.
Definition at line 440 of file thread_pool_diagnostics.cpp.
References kcenon::thread::thread_pool::is_running(), pool_, kcenon::thread::thread_pool::workers_, and kcenon::thread::thread_pool::workers_mutex_.
◆ is_tracing_enabled()
|
nodiscard |
Checks if tracing is enabled.
- Returns
- true if tracing is enabled.
Definition at line 615 of file thread_pool_diagnostics.cpp.
References tracing_enabled_.
◆ notify_listeners()
|
private |
Notifies all event listeners.
- Parameters
-
event The event to broadcast.
Definition at line 663 of file thread_pool_diagnostics.cpp.
References listeners_, and listeners_mutex_.
Referenced by record_event().

◆ operator=() [1/2]
|
delete |
◆ operator=() [2/2]
|
delete |
◆ record_event()
| void kcenon::thread::diagnostics::thread_pool_diagnostics::record_event | ( | const job_execution_event & | event | ) |
Records a job execution event.
- Parameters
-
event The event to record.
Called internally by the thread pool on job lifecycle events.
Definition at line 642 of file thread_pool_diagnostics.cpp.
References config_, event_history_, kcenon::thread::diagnostics::diagnostics_config::event_history_size, events_mutex_, notify_listeners(), and tracing_enabled_.
◆ record_job_completion()
| void kcenon::thread::diagnostics::thread_pool_diagnostics::record_job_completion | ( | const job_info & | info | ) |
Records a job completion for history tracking.
- Parameters
-
info The job information to record.
Called internally by the thread pool when jobs complete.
Definition at line 146 of file thread_pool_diagnostics.cpp.
References config_, kcenon::thread::info, jobs_mutex_, recent_jobs_, and kcenon::thread::diagnostics::diagnostics_config::recent_jobs_capacity.
◆ remove_event_listener()
| void kcenon::thread::diagnostics::thread_pool_diagnostics::remove_event_listener | ( | std::shared_ptr< execution_event_listener > | listener | ) |
Removes an event listener.
- Parameters
-
listener Listener to remove.
Definition at line 629 of file thread_pool_diagnostics.cpp.
References listeners_, and listeners_mutex_.
◆ set_config()
| void kcenon::thread::diagnostics::thread_pool_diagnostics::set_config | ( | const diagnostics_config & | config | ) |
Updates the configuration.
- Parameters
-
config New configuration to apply.
Definition at line 763 of file thread_pool_diagnostics.cpp.
References config_, kcenon::thread::diagnostics::diagnostics_config::enable_tracing, and tracing_enabled_.
◆ to_json()
|
nodiscard |
Exports diagnostics as JSON.
- Returns
- JSON string with all diagnostic data.
Definition at line 702 of file thread_pool_diagnostics.cpp.
References kcenon::thread::diagnostics::bottleneck_type_to_string(), detect_bottlenecks(), health_check(), and kcenon::thread::diagnostics::health_state_to_string().
◆ to_prometheus()
|
nodiscard |
Exports diagnostics as Prometheus-compatible metrics.
- Returns
- Prometheus exposition format string.
Produces metrics suitable for scraping by Prometheus or compatible monitoring systems. Includes health status, worker metrics, queue metrics, and job statistics.
Definition at line 748 of file thread_pool_diagnostics.cpp.
References health_check(), pool_, and kcenon::thread::thread_pool::to_string().
◆ to_string()
|
nodiscard |
Exports diagnostics as formatted string.
- Returns
- Human-readable string.
Definition at line 743 of file thread_pool_diagnostics.cpp.
References format_thread_dump().
Member Data Documentation
◆ config_
|
private |
Configuration for diagnostics.
Definition at line 351 of file thread_pool_diagnostics.h.
Referenced by check_queue_health(), detect_bottlenecks(), enable_tracing(), get_config(), record_event(), record_job_completion(), and set_config().
◆ event_history_
|
private |
Ring buffer for event history.
Definition at line 366 of file thread_pool_diagnostics.h.
Referenced by enable_tracing(), and record_event().
◆ events_mutex_
|
mutableprivate |
Mutex for event history access.
Definition at line 361 of file thread_pool_diagnostics.h.
Referenced by enable_tracing(), and record_event().
◆ jobs_mutex_
|
mutableprivate |
Mutex for recent jobs access.
Definition at line 371 of file thread_pool_diagnostics.h.
Referenced by record_job_completion().
◆ listeners_
|
private |
Event listeners.
Definition at line 386 of file thread_pool_diagnostics.h.
Referenced by add_event_listener(), notify_listeners(), and remove_event_listener().
◆ listeners_mutex_
|
mutableprivate |
Mutex for event listeners.
Definition at line 381 of file thread_pool_diagnostics.h.
Referenced by add_event_listener(), notify_listeners(), and remove_event_listener().
◆ next_event_id_
|
private |
◆ pool_
|
private |
Reference to the monitored thread pool.
Definition at line 346 of file thread_pool_diagnostics.h.
Referenced by check_queue_health(), check_worker_health(), detect_bottlenecks(), dump_thread_states(), format_thread_dump(), health_check(), is_healthy(), and to_prometheus().
◆ recent_jobs_
|
private |
Ring buffer for recent job completions.
Definition at line 376 of file thread_pool_diagnostics.h.
Referenced by record_job_completion().
◆ start_time_
|
private |
Time when the pool was started.
Definition at line 396 of file thread_pool_diagnostics.h.
Referenced by health_check().
◆ tracing_enabled_
|
private |
Whether event tracing is enabled.
Definition at line 356 of file thread_pool_diagnostics.h.
Referenced by enable_tracing(), is_tracing_enabled(), record_event(), and set_config().
The documentation for this class was generated from the following files:
- include/kcenon/thread/diagnostics/thread_pool_diagnostics.h
- src/diagnostics/thread_pool_diagnostics.cpp