Unit tests for performance monitoring functionality. More...
#include <gtest/gtest.h>#include <kcenon/monitoring/core/performance_monitor.h>#include <chrono>#include <random>#include <set>#include <thread>#include <vector>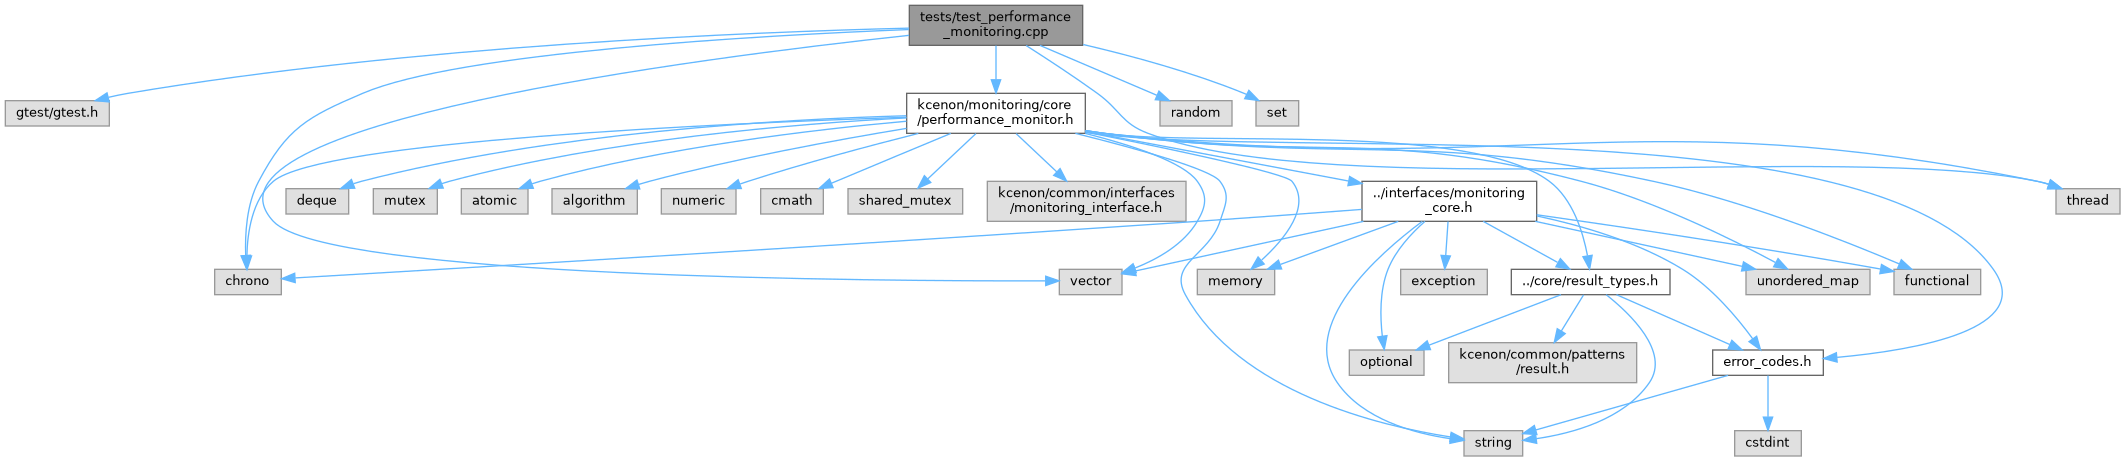
Go to the source code of this file.
Classes | |
| class | PerformanceMonitoringTest |
Detailed Description
Unit tests for performance monitoring functionality.
Definition in file test_performance_monitoring.cpp.
Function Documentation
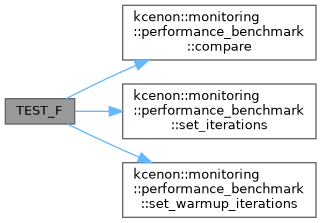
◆ TEST_F() [1/28]
| TEST_F | ( | PerformanceMonitoringTest | , |
| BenchmarkComparison | ) |
Definition at line 349 of file test_performance_monitoring.cpp.
References kcenon::monitoring::performance_benchmark::compare(), kcenon::monitoring::performance_benchmark::set_iterations(), and kcenon::monitoring::performance_benchmark::set_warmup_iterations().
◆ TEST_F() [2/28]
| TEST_F | ( | PerformanceMonitoringTest | , |
| ClearAllMetrics | ) |
Definition at line 542 of file test_performance_monitoring.cpp.
◆ TEST_F() [3/28]
| TEST_F | ( | PerformanceMonitoringTest | , |
| ClearSamples | ) |
Definition at line 169 of file test_performance_monitoring.cpp.
◆ TEST_F() [4/28]
| TEST_F | ( | PerformanceMonitoringTest | , |
| ConcurrentRecording | ) |
Definition at line 401 of file test_performance_monitoring.cpp.
◆ TEST_F() [5/28]
| TEST_F | ( | PerformanceMonitoringTest | , |
| EmptyMetricNameRejected | ) |
Definition at line 563 of file test_performance_monitoring.cpp.
◆ TEST_F() [6/28]
| TEST_F | ( | PerformanceMonitoringTest | , |
| GetAllMetrics | ) |
Definition at line 187 of file test_performance_monitoring.cpp.
◆ TEST_F() [7/28]
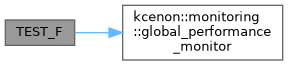
| TEST_F | ( | PerformanceMonitoringTest | , |
| GlobalPerformanceMonitor | ) |
Definition at line 312 of file test_performance_monitoring.cpp.
References kcenon::monitoring::global_performance_monitor(), and PERF_TIMER.
◆ TEST_F() [8/28]
| TEST_F | ( | PerformanceMonitoringTest | , |
| MaxSamplesLimit | ) |
Definition at line 381 of file test_performance_monitoring.cpp.
◆ TEST_F() [9/28]
| TEST_F | ( | PerformanceMonitoringTest | , |
| PercentileCalculation | ) |
Definition at line 125 of file test_performance_monitoring.cpp.
◆ TEST_F() [10/28]
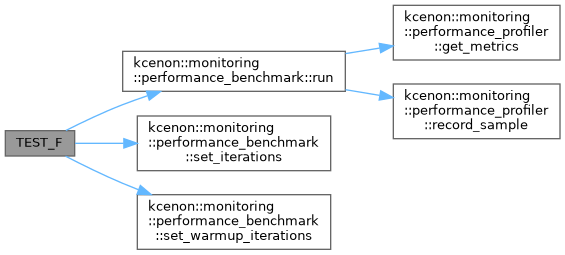
| TEST_F | ( | PerformanceMonitoringTest | , |
| PerformanceBenchmark | ) |
Definition at line 328 of file test_performance_monitoring.cpp.
References kcenon::monitoring::performance_benchmark::run(), kcenon::monitoring::performance_benchmark::set_iterations(), and kcenon::monitoring::performance_benchmark::set_warmup_iterations().
◆ TEST_F() [11/28]
| TEST_F | ( | PerformanceMonitoringTest | , |
| PerformanceMonitorCollect | ) |
Definition at line 269 of file test_performance_monitoring.cpp.
References kcenon::monitoring::metric::name.
◆ TEST_F() [12/28]
| TEST_F | ( | PerformanceMonitoringTest | , |
| ProfilerEnableDisable | ) |
Definition at line 205 of file test_performance_monitoring.cpp.
◆ TEST_F() [13/28]
| TEST_F | ( | PerformanceMonitoringTest | , |
| RecordCounterWithoutTags | ) |
Definition at line 431 of file test_performance_monitoring.cpp.
◆ TEST_F() [14/28]
| TEST_F | ( | PerformanceMonitoringTest | , |
| RecordCounterWithTags | ) |
Definition at line 447 of file test_performance_monitoring.cpp.
◆ TEST_F() [15/28]
| TEST_F | ( | PerformanceMonitoringTest | , |
| RecordErrorSamples | ) |
Definition at line 82 of file test_performance_monitoring.cpp.
◆ TEST_F() [16/28]
| TEST_F | ( | PerformanceMonitoringTest | , |
| RecordGaugeWithTags | ) |
Definition at line 480 of file test_performance_monitoring.cpp.
◆ TEST_F() [17/28]
| TEST_F | ( | PerformanceMonitoringTest | , |
| RecordHistogramWithTags | ) |
Definition at line 499 of file test_performance_monitoring.cpp.
◆ TEST_F() [18/28]
| TEST_F | ( | PerformanceMonitoringTest | , |
| RecordMultipleSamples | ) |
Definition at line 57 of file test_performance_monitoring.cpp.
◆ TEST_F() [19/28]
| TEST_F | ( | PerformanceMonitoringTest | , |
| RecordSingleSample | ) |
Definition at line 39 of file test_performance_monitoring.cpp.
◆ TEST_F() [20/28]
| TEST_F | ( | PerformanceMonitoringTest | , |
| ResetClearsTaggedMetrics | ) |
Definition at line 553 of file test_performance_monitoring.cpp.
◆ TEST_F() [21/28]
| TEST_F | ( | PerformanceMonitoringTest | , |
| ScopedTimer | ) |
Definition at line 96 of file test_performance_monitoring.cpp.
References kcenon::monitoring::timer.
◆ TEST_F() [22/28]
| TEST_F | ( | PerformanceMonitoringTest | , |
| ScopedTimerWithError | ) |
Definition at line 110 of file test_performance_monitoring.cpp.
References kcenon::monitoring::timer.
◆ TEST_F() [23/28]
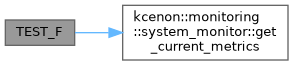
| TEST_F | ( | PerformanceMonitoringTest | , |
| SystemMetrics | ) |
Definition at line 222 of file test_performance_monitoring.cpp.
References kcenon::monitoring::system_monitor::get_current_metrics().
◆ TEST_F() [24/28]
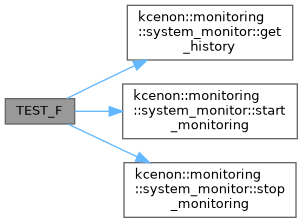
| TEST_F | ( | PerformanceMonitoringTest | , |
| SystemMonitoringHistory | ) |
Definition at line 241 of file test_performance_monitoring.cpp.
References kcenon::monitoring::system_monitor::get_history(), kcenon::monitoring::system_monitor::start_monitoring(), and kcenon::monitoring::system_monitor::stop_monitoring().
◆ TEST_F() [25/28]
| TEST_F | ( | PerformanceMonitoringTest | , |
| TaggedMetricsInCollect | ) |
Definition at line 515 of file test_performance_monitoring.cpp.
References kcenon::monitoring::metric::name, kcenon::monitoring::metric::tags, and kcenon::monitoring::metric::value.
◆ TEST_F() [26/28]
| TEST_F | ( | PerformanceMonitoringTest | , |
| TagKeyConsistency | ) |
Definition at line 568 of file test_performance_monitoring.cpp.
◆ TEST_F() [27/28]
| TEST_F | ( | PerformanceMonitoringTest | , |
| ThresholdChecking | ) |
Definition at line 296 of file test_performance_monitoring.cpp.
◆ TEST_F() [28/28]
| TEST_F | ( | PerformanceMonitoringTest | , |
| ThroughputCalculation | ) |
Definition at line 152 of file test_performance_monitoring.cpp.