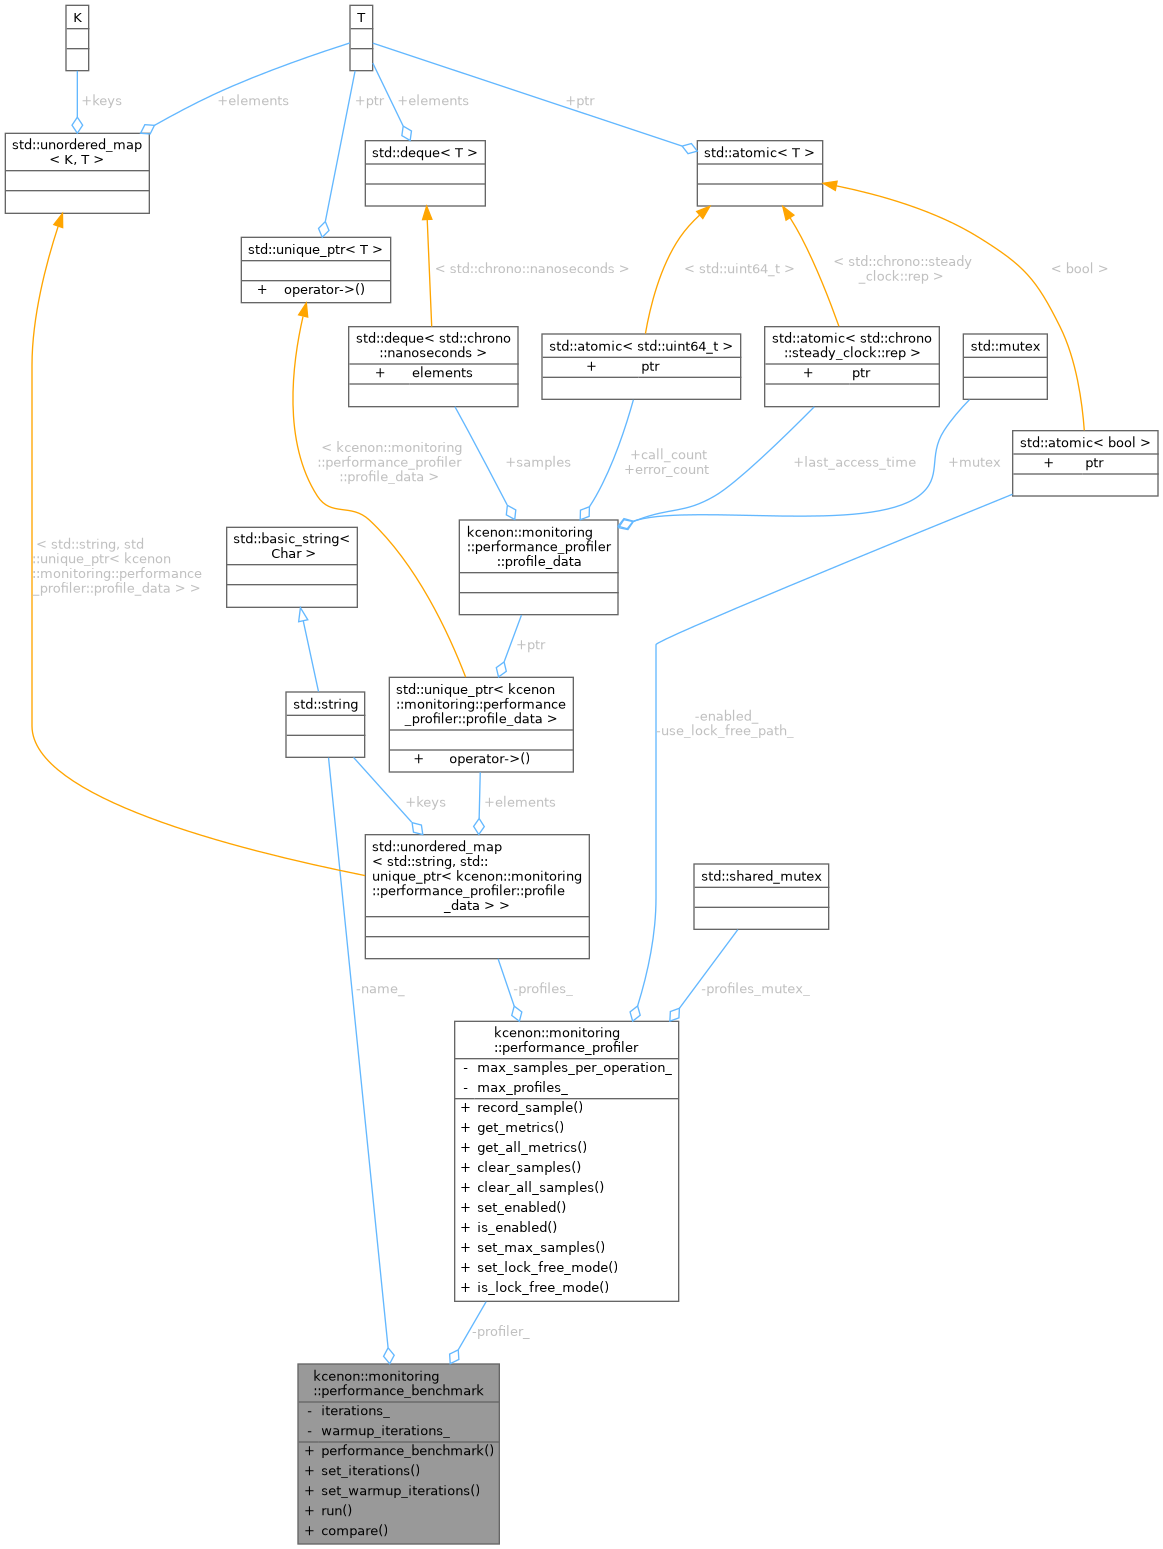
Performance benchmark utility. More...
#include <performance_monitor.h>
Public Member Functions | |
| performance_benchmark (const std::string &name) | |
| void | set_iterations (std::uint32_t iterations) |
| Set number of benchmark iterations. | |
| void | set_warmup_iterations (std::uint32_t warmup) |
| Set number of warmup iterations. | |
| template<typename Func > | |
| common::Result< performance_metrics > | run (const std::string &operation_name, Func &&func) |
| Run a benchmark. | |
| template<typename Func1 , typename Func2 > | |
| common::Result< std::pair< performance_metrics, performance_metrics > > | compare (const std::string &operation1_name, Func1 &&func1, const std::string &operation2_name, Func2 &&func2) |
| Compare two operations. | |
Private Attributes | |
| performance_profiler | profiler_ |
| std::string | name_ |
| std::uint32_t | iterations_ {1000} |
| std::uint32_t | warmup_iterations_ {100} |
Detailed Description
Performance benchmark utility.
Definition at line 627 of file performance_monitor.h.
Constructor & Destructor Documentation
◆ performance_benchmark()
|
inlineexplicit |
Definition at line 635 of file performance_monitor.h.
Member Function Documentation
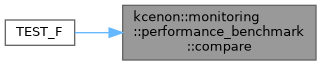
◆ compare()
|
inline |
Compare two operations.
Definition at line 697 of file performance_monitor.h.
Referenced by TEST_F().
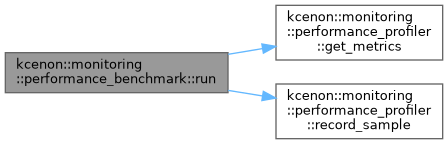
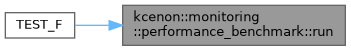
◆ run()
|
inline |
Run a benchmark.
Definition at line 658 of file performance_monitor.h.
References kcenon::monitoring::performance_profiler::get_metrics(), and kcenon::monitoring::performance_profiler::record_sample().
Referenced by TEST_F().
◆ set_iterations()
|
inline |
Set number of benchmark iterations.
- Parameters
-
iterations Number of iterations to run during the benchmark
Definition at line 642 of file performance_monitor.h.
Referenced by TEST_F(), and TEST_F().
◆ set_warmup_iterations()
|
inline |
Set number of warmup iterations.
- Parameters
-
warmup Number of warmup iterations to run before the benchmark
Definition at line 650 of file performance_monitor.h.
Referenced by TEST_F(), and TEST_F().
Member Data Documentation
◆ iterations_
|
private |
Definition at line 631 of file performance_monitor.h.
◆ name_
|
private |
Definition at line 630 of file performance_monitor.h.
◆ profiler_
|
private |
Definition at line 629 of file performance_monitor.h.
◆ warmup_iterations_
|
private |
Definition at line 632 of file performance_monitor.h.
The documentation for this class was generated from the following file:
- include/kcenon/monitoring/core/performance_monitor.h