29 {
30 std::cout << "=== Basic Monitoring Example ===" << std::endl;
31
32 try {
33
38
39 std::cout << "1. Creating monitoring system with configuration:" << std::endl;
40 std::cout <<
" - History size: " << config.
history_size << std::endl;
41 std::cout << " - Collection interval: 1000ms" << std::endl;
42
43
45
46
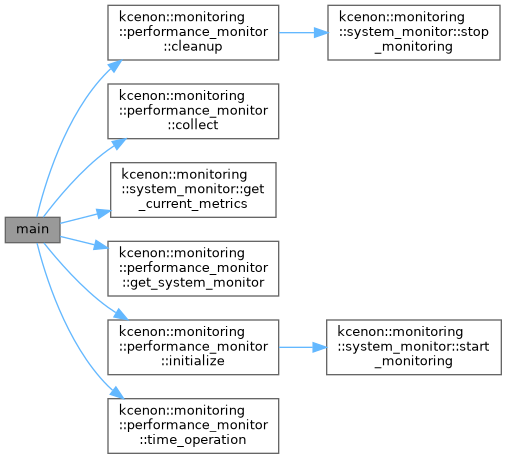
47 if (auto result = perf_monitor.initialize(); result.is_err()) {
48 std::cerr << "Failed to initialize performance monitor: "
49 << result.error().message << std::endl;
50 return 1;
51 }
52
53 std::cout << "2. Initialized performance monitor" << std::endl;
54
55
57 storage_cfg.
type = storage_backend_type::file_json;
58 storage_cfg.
path =
"monitoring_data.json";
59
60 auto storage = std::make_unique<file_storage_backend>(storage_cfg);
61
62
63
64
65
66 std::cout << "3. Configured JSON file storage backend" << std::endl;
67
68 std::cout << "4. Monitoring system ready" << std::endl;
69 std::cout << std::endl;
70
71
72 std::cout << "5. Simulating application workload..." << std::endl;
73
74 for (int i = 0; i < 10; ++i) {
75 std::cout << " Iteration " << (i + 1) << "/10" << std::endl;
76
77
78 {
79 auto timer = perf_monitor.time_operation(
"iteration_" + std::to_string(i));
80 std::this_thread::sleep_for(100ms);
81 }
82
83
84 std::this_thread::sleep_for(500ms);
85
86
87 auto system_metrics = perf_monitor.get_system_monitor().get_current_metrics();
90 <<
"%, Memory: " << (
system_metrics.value().memory_usage_bytes / (1024.0 * 1024.0)) <<
" MB" << std::endl;
91 }
92 }
93
94 std::cout << std::endl;
95
96
97 std::cout << "6. Collecting metrics:" << std::endl;
98
99 auto metrics_result = perf_monitor.collect();
100 if (metrics_result.is_ok()) {
101 auto& snapshot = metrics_result.value();
102 std::cout << " Total metrics collected: " << snapshot.metrics.size() << std::endl;
103
104 for (
const auto&
metric : snapshot.metrics) {
105 std::cout <<
" - Metric: " <<
metric.
name << std::endl;
106 }
107 }
108
109 std::cout << std::endl;
110
111
112 if (auto result = perf_monitor.cleanup(); result.is_err()) {
113 std::cerr << "Failed to cleanup: "
114 << result.error().message << std::endl;
115 return 1;
116 }
117
118
119 if (
auto result =
storage->flush(); result.is_err()) {
120 std::cerr << "Failed to flush storage: "
121 << result.error().message << std::endl;
122 }
123
124 std::cout << std::endl;
125 std::cout << "7. Monitoring completed successfully" << std::endl;
126 std::cout << " Data saved to: monitoring_data.json" << std::endl;
127
128 } catch (const std::exception& e) {
129 std::cerr << "Exception: " << e.what() << std::endl;
130 return 1;
131 }
132
133 std::cout << std::endl;
134 std::cout << "=== Example completed successfully ===" << std::endl;
135
136 return 0;
137}
@ timer
StatsD-specific timer metric.
@ storage
Storage device sensor.
Basic metric structure for interface compatibility.
Configuration for the monitoring system.
std::chrono::milliseconds collection_interval
storage_backend_type type