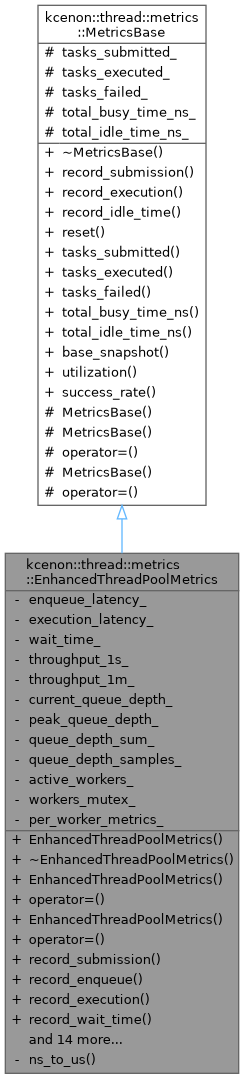
Enhanced thread pool metrics with histograms and percentiles. More...
#include <enhanced_metrics.h>
Public Member Functions | |
| EnhancedThreadPoolMetrics (std::size_t worker_count=0) | |
| Constructs enhanced metrics with the specified worker count. | |
| ~EnhancedThreadPoolMetrics () override=default | |
| Destructor. | |
| EnhancedThreadPoolMetrics (const EnhancedThreadPoolMetrics &)=delete | |
| EnhancedThreadPoolMetrics & | operator= (const EnhancedThreadPoolMetrics &)=delete |
| EnhancedThreadPoolMetrics (EnhancedThreadPoolMetrics &&)=delete | |
| EnhancedThreadPoolMetrics & | operator= (EnhancedThreadPoolMetrics &&)=delete |
| void | record_submission () |
| Record a task submission. | |
| void | record_enqueue (std::chrono::nanoseconds latency) |
| Record enqueue operation latency. | |
| void | record_execution (std::chrono::nanoseconds latency, bool success) |
| Record task execution completion. | |
| void | record_wait_time (std::chrono::nanoseconds wait) |
| Record wait time (time spent in queue). | |
| void | record_queue_depth (std::size_t depth) |
| Record current queue depth. | |
| void | record_worker_state (std::size_t worker_id, bool busy, std::uint64_t duration_ns=0) |
| Update worker state. | |
| void | set_active_workers (std::size_t count) |
| Set the number of active workers. | |
| EnhancedSnapshot | snapshot () const |
| Get a comprehensive snapshot of all metrics. | |
| const LatencyHistogram & | enqueue_latency () const |
| Get the enqueue latency histogram (read-only). | |
| const LatencyHistogram & | execution_latency () const |
| Get the execution latency histogram (read-only). | |
| const LatencyHistogram & | wait_time () const |
| Get the wait time histogram (read-only). | |
| std::vector< WorkerMetrics > | worker_metrics () const |
| Get per-worker metrics. | |
| const SlidingWindowCounter & | throughput_1s () const |
| Get the 1-second throughput counter (read-only). | |
| const SlidingWindowCounter & | throughput_1m () const |
| Get the 1-minute throughput counter (read-only). | |
| void | reset () override |
| Reset all metrics to initial state. | |
| void | update_worker_count (std::size_t count) |
| Update worker count. | |
| std::string | to_json () const |
| Export metrics as JSON string. | |
| std::string | to_prometheus (const std::string &prefix="thread_pool") const |
| Export metrics in Prometheus/OpenMetrics format. | |
 Public Member Functions inherited from kcenon::thread::metrics::MetricsBase Public Member Functions inherited from kcenon::thread::metrics::MetricsBase | |
| virtual | ~MetricsBase ()=default |
| Virtual destructor for proper cleanup in derived classes. | |
| void | record_submission (std::size_t count=1) |
| Record task submission(s). | |
| void | record_execution (std::uint64_t duration_ns, bool success) |
| Record task execution completion. | |
| void | record_idle_time (std::uint64_t duration_ns) |
| Record idle time. | |
| std::uint64_t | tasks_submitted () const |
| Get the total number of tasks submitted. | |
| std::uint64_t | tasks_executed () const |
| Get the total number of tasks successfully executed. | |
| std::uint64_t | tasks_failed () const |
| Get the total number of failed tasks. | |
| std::uint64_t | total_busy_time_ns () const |
| Get the total busy time in nanoseconds. | |
| std::uint64_t | total_idle_time_ns () const |
| Get the total idle time in nanoseconds. | |
| BaseSnapshot | base_snapshot () const |
| Get a base snapshot of common metrics. | |
| double | utilization () const |
| Calculate worker utilization ratio. | |
| double | success_rate () const |
| Calculate task success rate. | |
Static Private Member Functions | |
| static double | ns_to_us (double ns) |
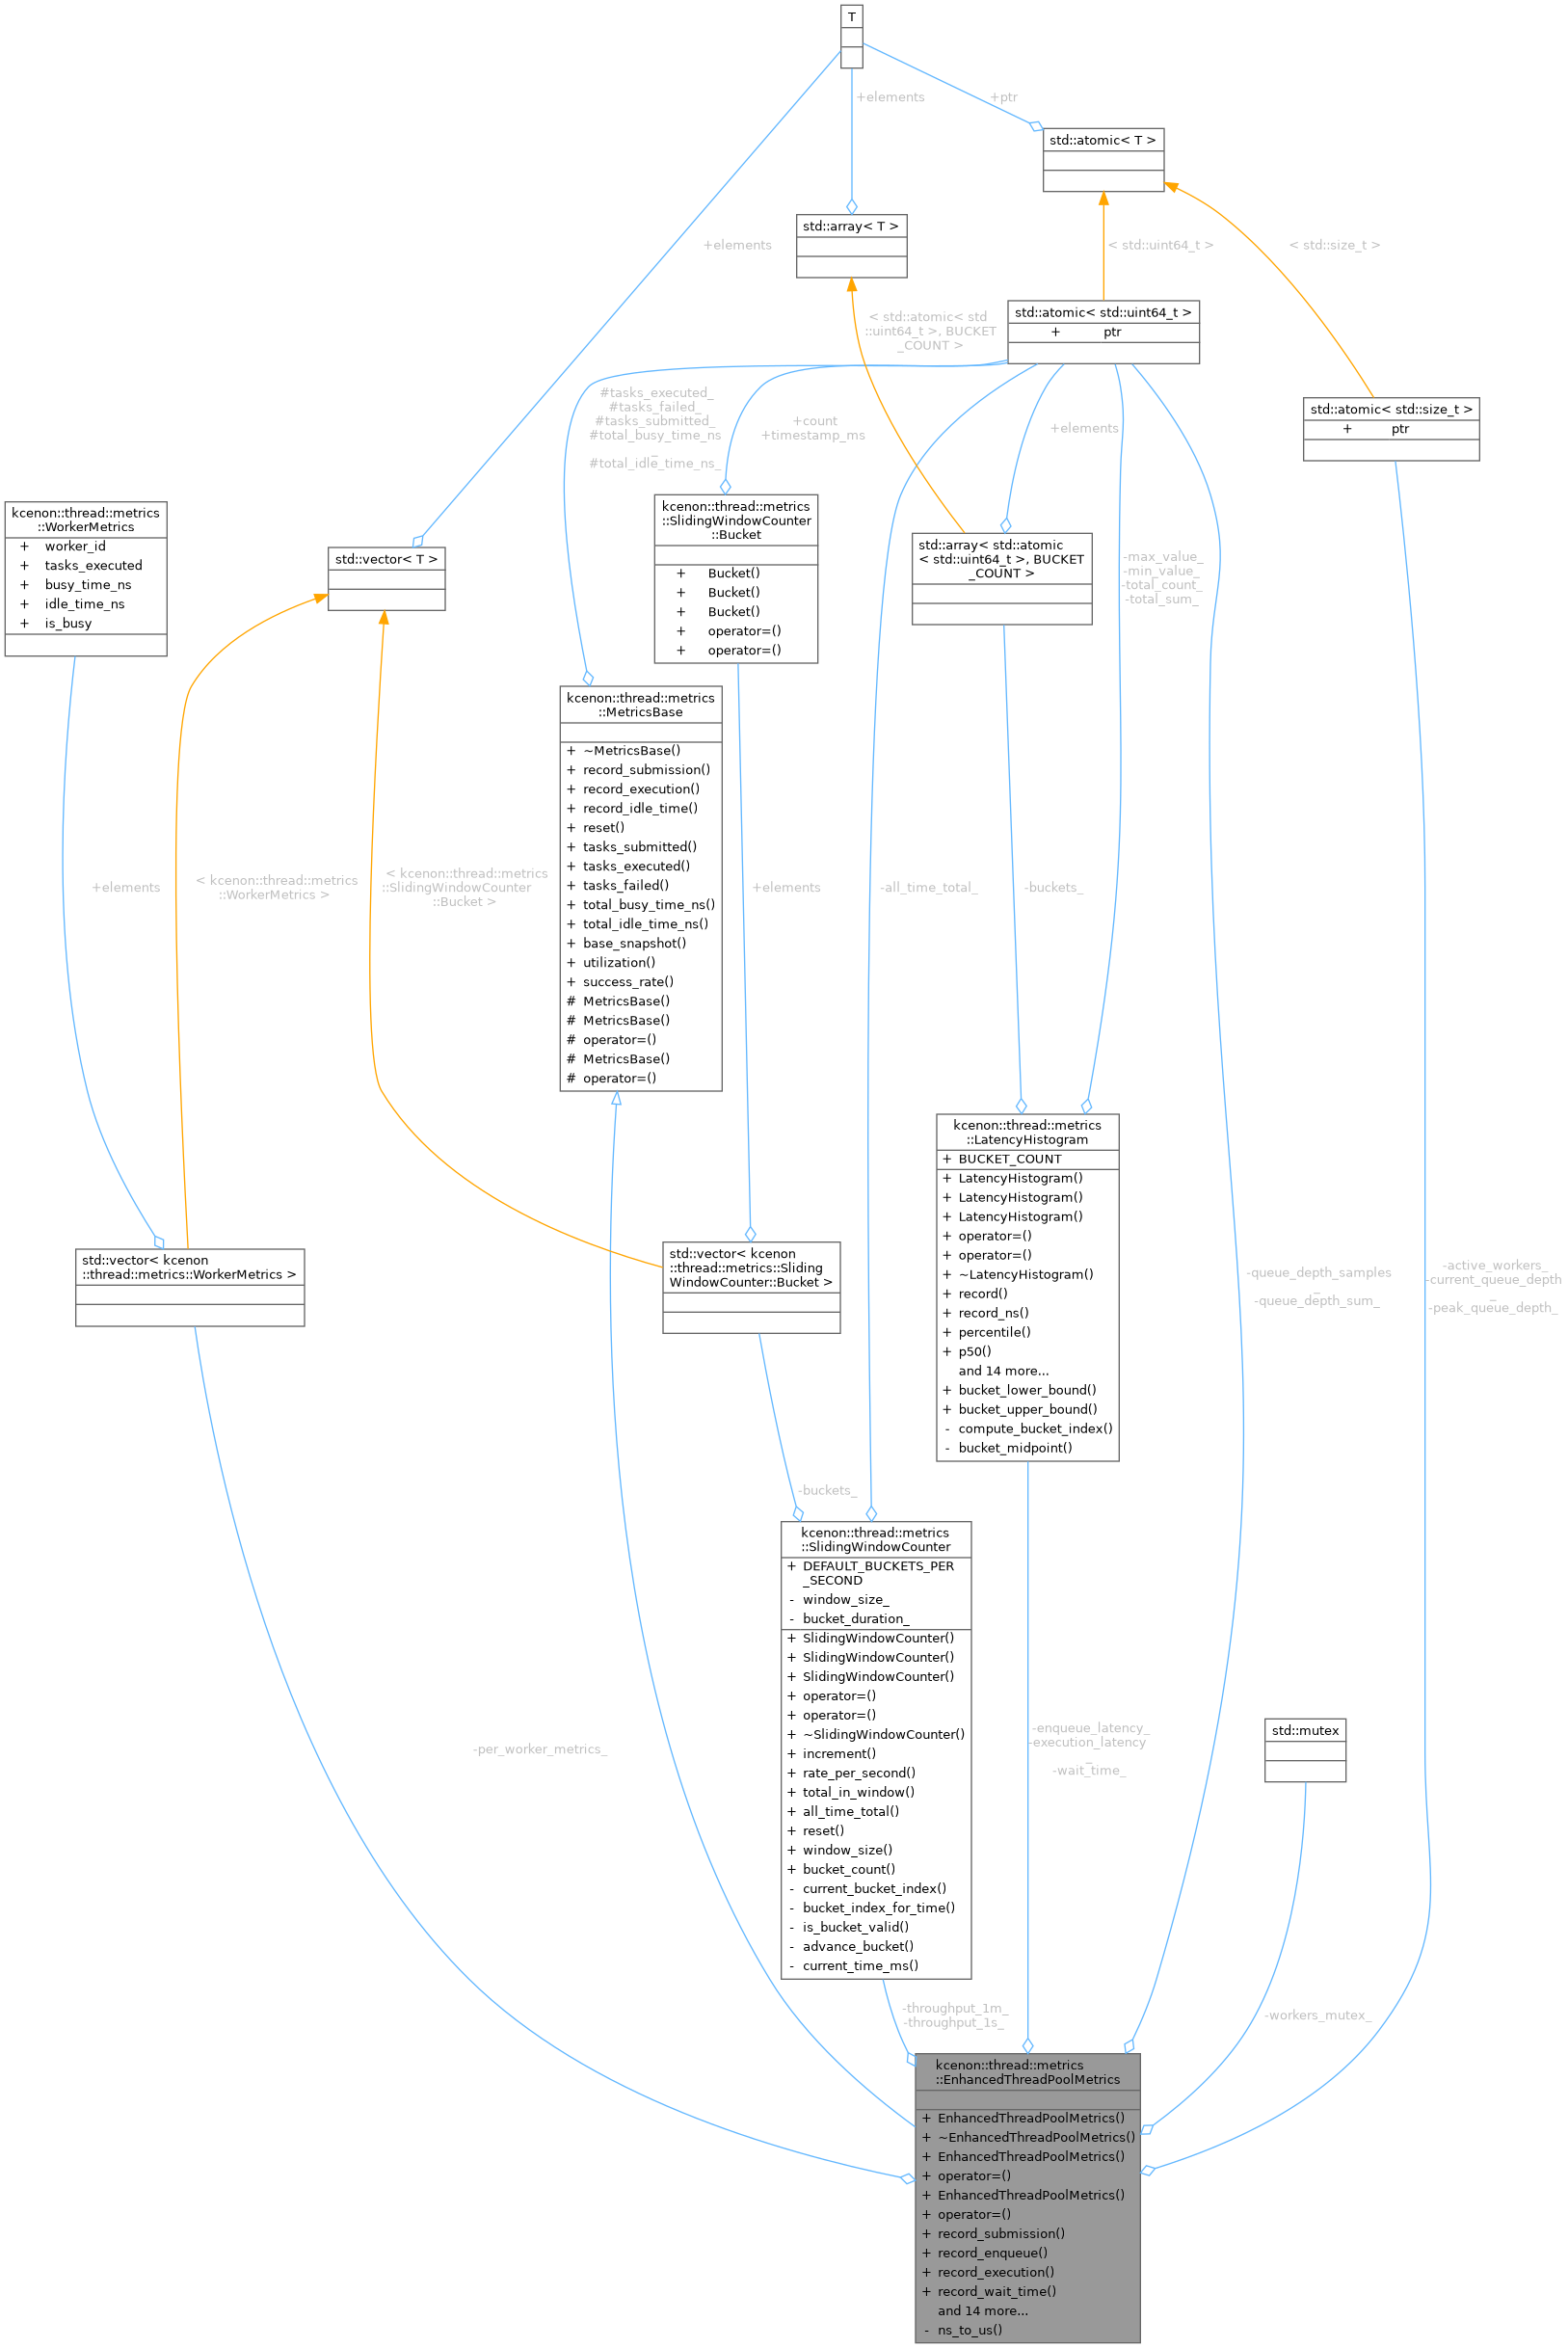
Private Attributes | |
| LatencyHistogram | enqueue_latency_ |
| LatencyHistogram | execution_latency_ |
| LatencyHistogram | wait_time_ |
| SlidingWindowCounter | throughput_1s_ |
| SlidingWindowCounter | throughput_1m_ |
| std::atomic< std::size_t > | current_queue_depth_ {0} |
| std::atomic< std::size_t > | peak_queue_depth_ {0} |
| std::atomic< std::uint64_t > | queue_depth_sum_ {0} |
| std::atomic< std::uint64_t > | queue_depth_samples_ {0} |
| std::atomic< std::size_t > | active_workers_ {0} |
| std::mutex | workers_mutex_ |
| std::vector< WorkerMetrics > | per_worker_metrics_ |
Additional Inherited Members | |
| Protected Member Functions inherited from kcenon::thread::metrics::MetricsBase | |
| MetricsBase ()=default | |
| Default constructor. | |
| MetricsBase (const MetricsBase &)=delete | |
| Copy constructor (deleted for thread safety). | |
| MetricsBase & | operator= (const MetricsBase &)=delete |
| Copy assignment operator (deleted for thread safety). | |
| MetricsBase (MetricsBase &&)=delete | |
| Move constructor (deleted for thread safety). | |
| MetricsBase & | operator= (MetricsBase &&)=delete |
| Move assignment operator (deleted for thread safety). | |
| Protected Attributes inherited from kcenon::thread::metrics::MetricsBase | |
| std::atomic< std::uint64_t > | tasks_submitted_ {0} |
| Counter for submitted tasks. | |
| std::atomic< std::uint64_t > | tasks_executed_ {0} |
| Counter for successfully executed tasks. | |
| std::atomic< std::uint64_t > | tasks_failed_ {0} |
| Counter for failed tasks. | |
| std::atomic< std::uint64_t > | total_busy_time_ns_ {0} |
| Accumulated busy time in nanoseconds. | |
| std::atomic< std::uint64_t > | total_idle_time_ns_ {0} |
| Accumulated idle time in nanoseconds. | |
Detailed Description
Enhanced thread pool metrics with histograms and percentiles.
This class provides production-grade observability for thread pools, including:
- Latency histograms for enqueue, execution, and wait times
- Percentile calculations (P50, P90, P99)
- Sliding window throughput tracking
- Per-worker utilization metrics
- Queue depth monitoring
Performance Characteristics
- record_* overhead: < 100ns
- snapshot() latency: < 10μs
- Memory per histogram: < 1KB
- Memory per counter: < 4KB (for 60s window)
Thread Safety
All methods are thread-safe. Recording methods use lock-free atomics. Snapshot generation acquires a brief mutex for consistency.
Usage Example
Definition at line 251 of file enhanced_metrics.h.
Constructor & Destructor Documentation
◆ EnhancedThreadPoolMetrics() [1/3]
|
explicit |
Constructs enhanced metrics with the specified worker count.
- Parameters
-
worker_count Number of workers to track individually.
Definition at line 10 of file enhanced_metrics.cpp.
References per_worker_metrics_.
◆ ~EnhancedThreadPoolMetrics()
|
overridedefault |
Destructor.
◆ EnhancedThreadPoolMetrics() [2/3]
|
delete |
◆ EnhancedThreadPoolMetrics() [3/3]
|
delete |
Member Function Documentation
◆ enqueue_latency()
|
nodiscard |
Get the enqueue latency histogram (read-only).
- Returns
- Reference to the enqueue latency histogram.
Definition at line 166 of file enhanced_metrics.cpp.
References enqueue_latency_.
◆ execution_latency()
|
nodiscard |
Get the execution latency histogram (read-only).
- Returns
- Reference to the execution latency histogram.
Definition at line 170 of file enhanced_metrics.cpp.
References execution_latency_.
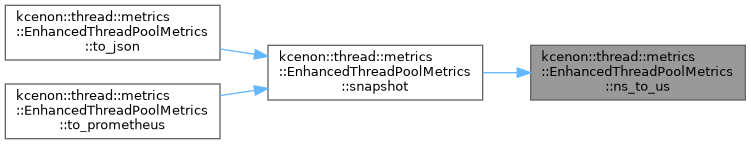
◆ ns_to_us()
|
inlinestaticnodiscardprivate |
Definition at line 433 of file enhanced_metrics.h.
Referenced by snapshot().
◆ operator=() [1/2]
|
delete |
◆ operator=() [2/2]
|
delete |
◆ record_enqueue()
| void kcenon::thread::metrics::EnhancedThreadPoolMetrics::record_enqueue | ( | std::chrono::nanoseconds | latency | ) |
Record enqueue operation latency.
- Parameters
-
latency The time taken to enqueue a task.
Definition at line 23 of file enhanced_metrics.cpp.
References enqueue_latency_, kcenon::thread::latency, and kcenon::thread::metrics::LatencyHistogram::record().

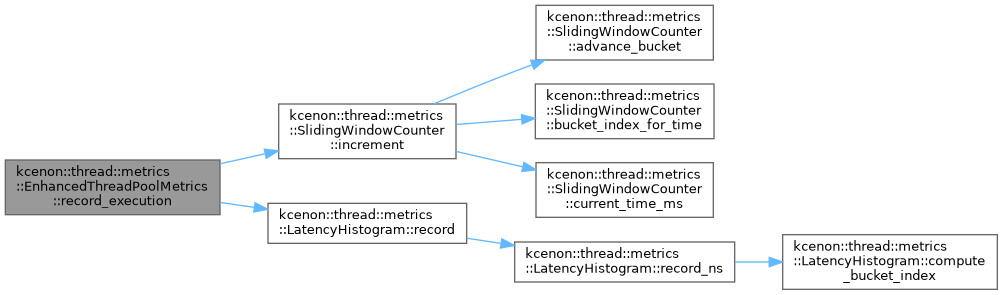
◆ record_execution()
| void kcenon::thread::metrics::EnhancedThreadPoolMetrics::record_execution | ( | std::chrono::nanoseconds | latency, |
| bool | success ) |
Record task execution completion.
- Parameters
-
latency The execution duration. success Whether the task completed successfully.
Definition at line 27 of file enhanced_metrics.cpp.
References execution_latency_, kcenon::thread::metrics::SlidingWindowCounter::increment(), kcenon::thread::latency, kcenon::thread::metrics::LatencyHistogram::record(), kcenon::thread::success, kcenon::thread::metrics::MetricsBase::tasks_executed_, kcenon::thread::metrics::MetricsBase::tasks_failed_, throughput_1m_, and throughput_1s_.
◆ record_queue_depth()
| void kcenon::thread::metrics::EnhancedThreadPoolMetrics::record_queue_depth | ( | std::size_t | depth | ) |
Record current queue depth.
- Parameters
-
depth The current number of tasks in the queue.
Definition at line 47 of file enhanced_metrics.cpp.
References current_queue_depth_, peak_queue_depth_, queue_depth_samples_, and queue_depth_sum_.
◆ record_submission()
| void kcenon::thread::metrics::EnhancedThreadPoolMetrics::record_submission | ( | ) |
Record a task submission.
Definition at line 19 of file enhanced_metrics.cpp.
References kcenon::thread::metrics::MetricsBase::tasks_submitted_.
◆ record_wait_time()
| void kcenon::thread::metrics::EnhancedThreadPoolMetrics::record_wait_time | ( | std::chrono::nanoseconds | wait | ) |
Record wait time (time spent in queue).
- Parameters
-
wait The duration the task waited in the queue.
Definition at line 43 of file enhanced_metrics.cpp.
References kcenon::thread::metrics::LatencyHistogram::record(), and wait_time_.

◆ record_worker_state()
| void kcenon::thread::metrics::EnhancedThreadPoolMetrics::record_worker_state | ( | std::size_t | worker_id, |
| bool | busy, | ||
| std::uint64_t | duration_ns = 0 ) |
Update worker state.
- Parameters
-
worker_id The worker's identifier. busy Whether the worker is currently busy. duration_ns Duration in the previous state (for utilization calc).
Definition at line 66 of file enhanced_metrics.cpp.
References per_worker_metrics_, kcenon::thread::metrics::MetricsBase::total_busy_time_ns_, kcenon::thread::metrics::MetricsBase::total_idle_time_ns_, and workers_mutex_.
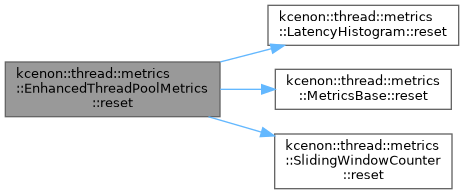
◆ reset()
|
overridevirtual |
Reset all metrics to initial state.
Clears all histograms, counters, and per-worker stats.
Reimplemented from kcenon::thread::metrics::MetricsBase.
Definition at line 191 of file enhanced_metrics.cpp.
References current_queue_depth_, enqueue_latency_, execution_latency_, peak_queue_depth_, per_worker_metrics_, queue_depth_samples_, queue_depth_sum_, kcenon::thread::metrics::LatencyHistogram::reset(), kcenon::thread::metrics::MetricsBase::reset(), kcenon::thread::metrics::SlidingWindowCounter::reset(), throughput_1m_, throughput_1s_, wait_time_, and workers_mutex_.
◆ set_active_workers()
| void kcenon::thread::metrics::EnhancedThreadPoolMetrics::set_active_workers | ( | std::size_t | count | ) |
Set the number of active workers.
- Parameters
-
count Number of currently active workers.
Definition at line 94 of file enhanced_metrics.cpp.
References active_workers_.
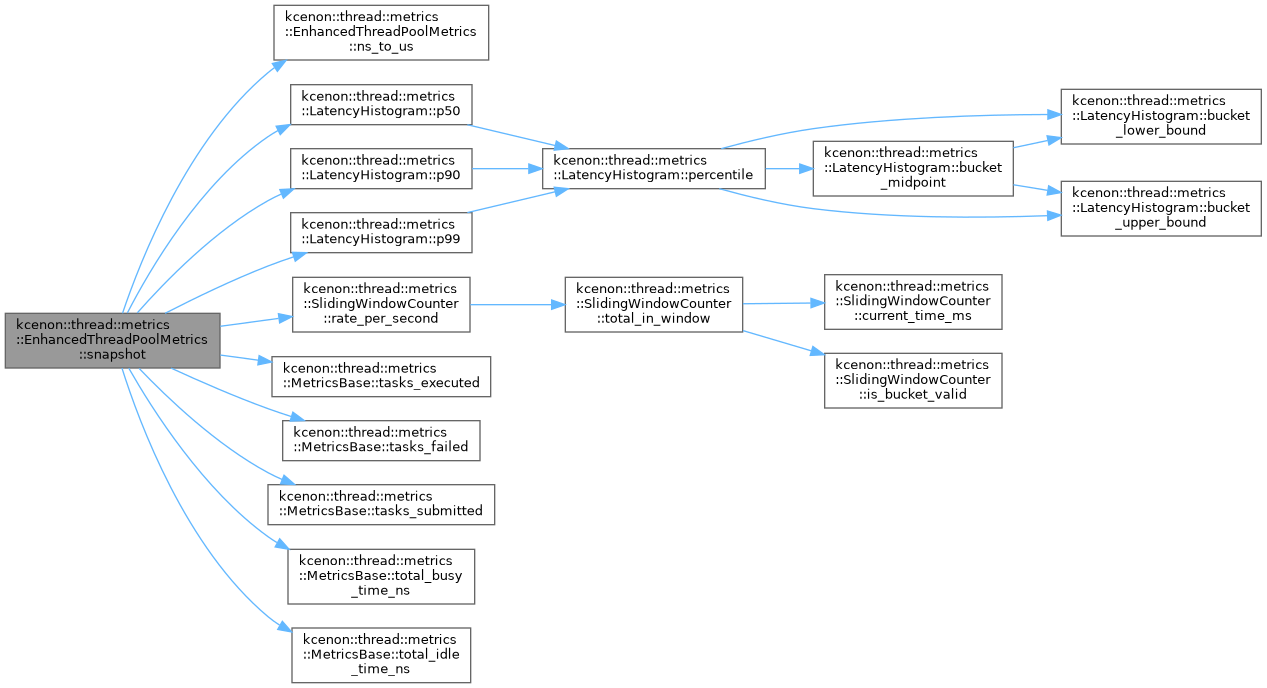
◆ snapshot()
|
nodiscard |
Get a comprehensive snapshot of all metrics.
- Returns
- EnhancedSnapshot with current metric values.
This method is thread-safe and provides a consistent view of all metrics.
Definition at line 98 of file enhanced_metrics.cpp.
References kcenon::thread::metrics::EnhancedSnapshot::active_workers, active_workers_, kcenon::thread::metrics::EnhancedSnapshot::avg_queue_depth, kcenon::thread::metrics::EnhancedSnapshot::current_queue_depth, current_queue_depth_, enqueue_latency_, kcenon::thread::metrics::EnhancedSnapshot::enqueue_latency_p50_us, kcenon::thread::metrics::EnhancedSnapshot::enqueue_latency_p90_us, kcenon::thread::metrics::EnhancedSnapshot::enqueue_latency_p99_us, execution_latency_, kcenon::thread::metrics::EnhancedSnapshot::execution_latency_p50_us, kcenon::thread::metrics::EnhancedSnapshot::execution_latency_p90_us, kcenon::thread::metrics::EnhancedSnapshot::execution_latency_p99_us, ns_to_us(), kcenon::thread::metrics::LatencyHistogram::p50(), kcenon::thread::metrics::LatencyHistogram::p90(), kcenon::thread::metrics::LatencyHistogram::p99(), kcenon::thread::metrics::EnhancedSnapshot::peak_queue_depth, peak_queue_depth_, per_worker_metrics_, kcenon::thread::metrics::EnhancedSnapshot::per_worker_utilization, queue_depth_samples_, queue_depth_sum_, kcenon::thread::metrics::SlidingWindowCounter::rate_per_second(), kcenon::thread::metrics::EnhancedSnapshot::snapshot_time, kcenon::thread::metrics::EnhancedSnapshot::tasks_executed, kcenon::thread::metrics::MetricsBase::tasks_executed(), kcenon::thread::metrics::EnhancedSnapshot::tasks_failed, kcenon::thread::metrics::MetricsBase::tasks_failed(), kcenon::thread::metrics::EnhancedSnapshot::tasks_submitted, kcenon::thread::metrics::MetricsBase::tasks_submitted(), kcenon::thread::metrics::EnhancedSnapshot::throughput_1m, throughput_1m_, kcenon::thread::metrics::EnhancedSnapshot::throughput_1s, throughput_1s_, kcenon::thread::metrics::EnhancedSnapshot::total_busy_time_ns, kcenon::thread::metrics::MetricsBase::total_busy_time_ns(), kcenon::thread::metrics::EnhancedSnapshot::total_idle_time_ns, kcenon::thread::metrics::MetricsBase::total_idle_time_ns(), wait_time_, kcenon::thread::metrics::EnhancedSnapshot::wait_time_p50_us, kcenon::thread::metrics::EnhancedSnapshot::wait_time_p90_us, kcenon::thread::metrics::EnhancedSnapshot::wait_time_p99_us, kcenon::thread::metrics::EnhancedSnapshot::worker_utilization, and workers_mutex_.
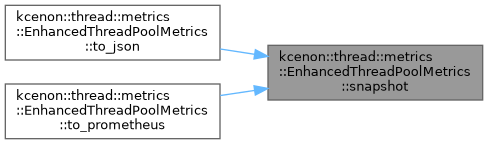
Referenced by to_json(), and to_prometheus().
◆ throughput_1m()
|
nodiscard |
Get the 1-minute throughput counter (read-only).
- Returns
- Reference to the 1-minute throughput counter.
Definition at line 187 of file enhanced_metrics.cpp.
References throughput_1m_.
◆ throughput_1s()
|
nodiscard |
Get the 1-second throughput counter (read-only).
- Returns
- Reference to the 1-second throughput counter.
Definition at line 183 of file enhanced_metrics.cpp.
References throughput_1s_.
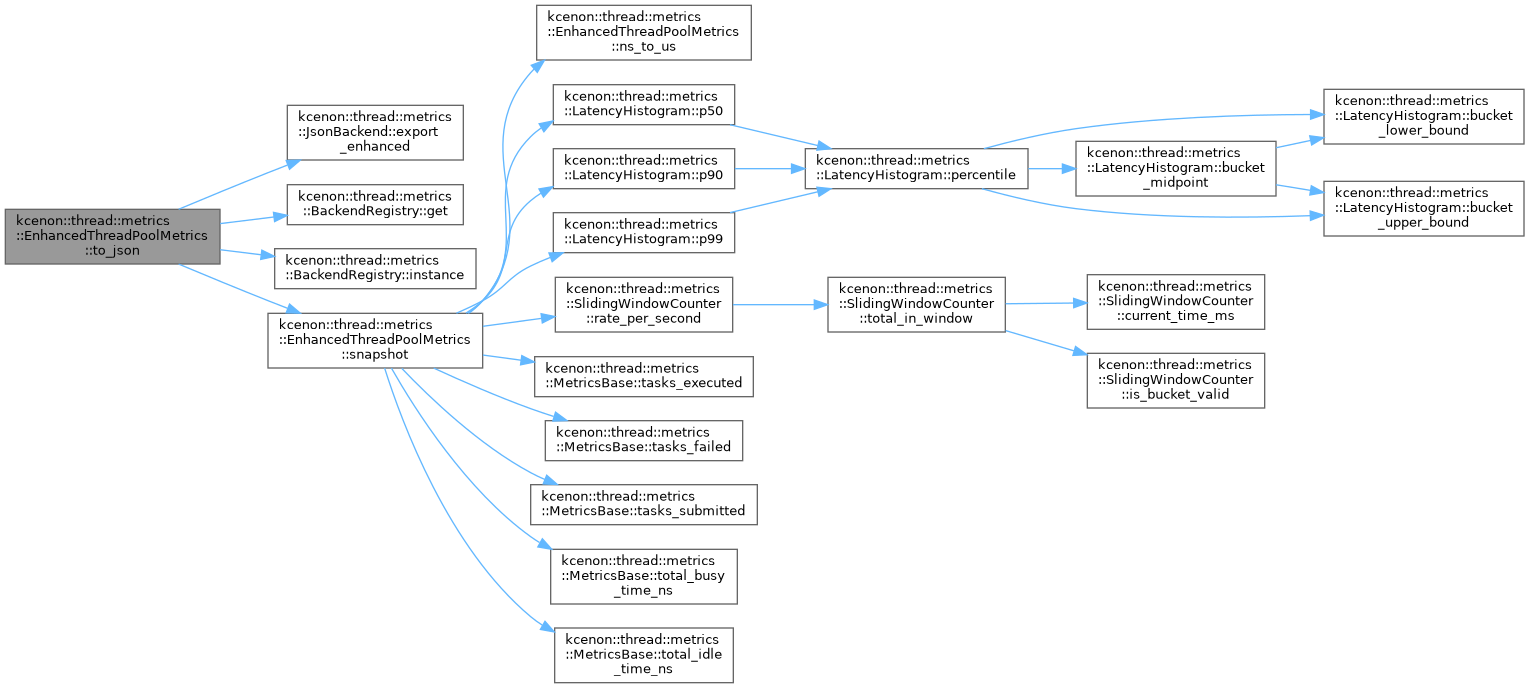
◆ to_json()
|
nodiscard |
Export metrics as JSON string.
- Returns
- JSON representation of the current metrics.
Definition at line 233 of file enhanced_metrics.cpp.
References kcenon::thread::metrics::JsonBackend::export_enhanced(), kcenon::thread::fallback, kcenon::thread::metrics::BackendRegistry::get(), kcenon::thread::metrics::BackendRegistry::instance(), and snapshot().
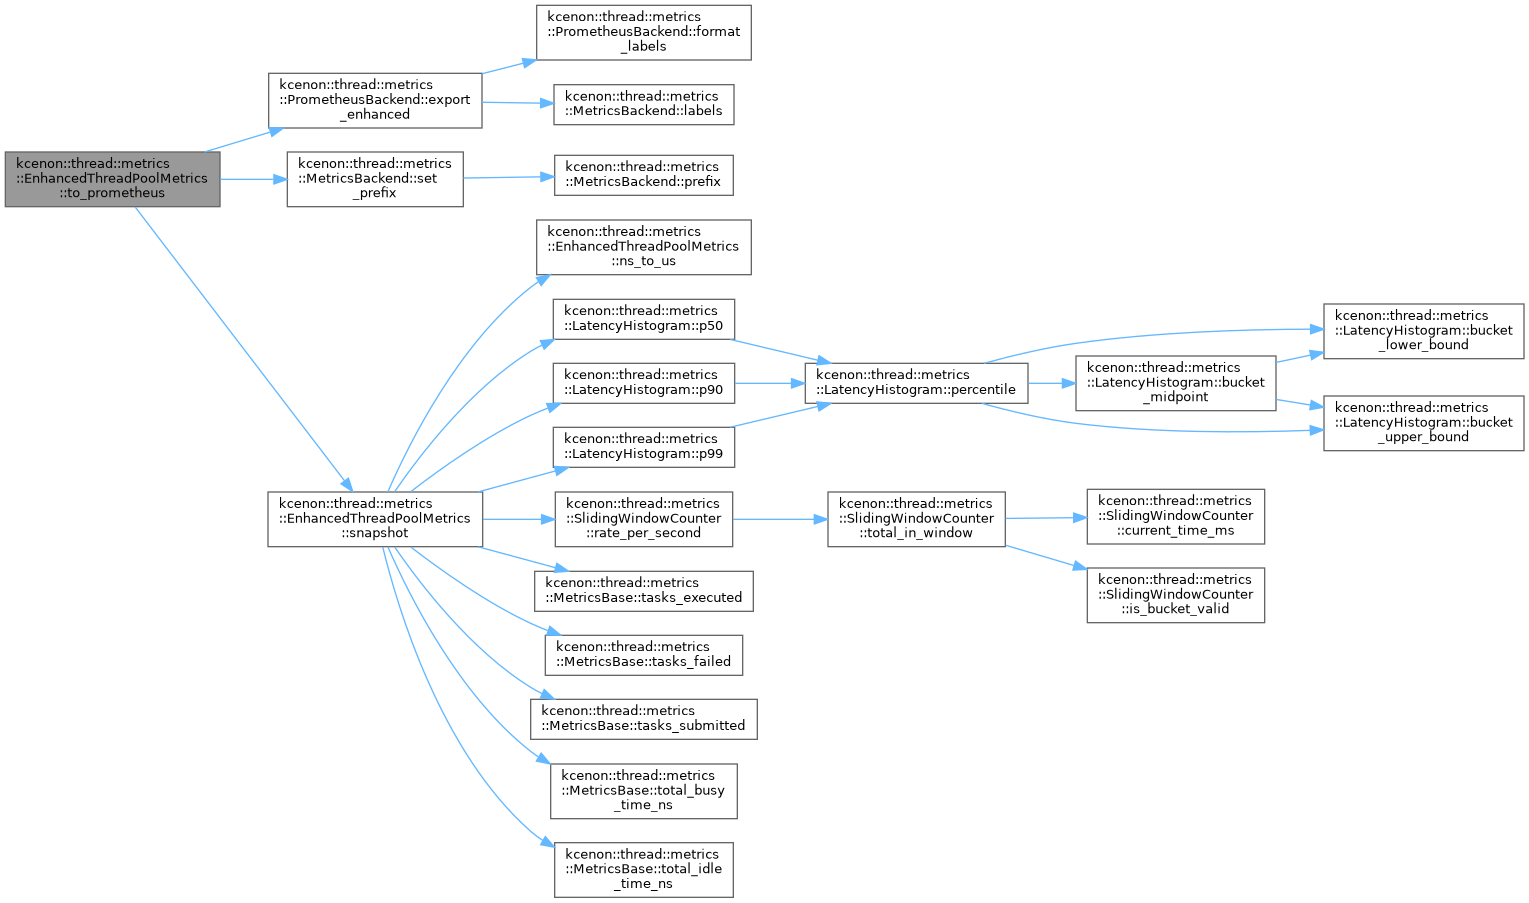
◆ to_prometheus()
|
nodiscard |
Export metrics in Prometheus/OpenMetrics format.
- Parameters
-
prefix Metric name prefix (e.g., "thread_pool").
- Returns
- Prometheus-compatible metrics string.
Definition at line 245 of file enhanced_metrics.cpp.
References kcenon::thread::metrics::PrometheusBackend::export_enhanced(), kcenon::thread::metrics::MetricsBackend::set_prefix(), and snapshot().
◆ update_worker_count()
| void kcenon::thread::metrics::EnhancedThreadPoolMetrics::update_worker_count | ( | std::size_t | count | ) |
Update worker count.
- Parameters
-
count New number of workers to track.
Call this when the thread pool scales up or down.
Definition at line 222 of file enhanced_metrics.cpp.
References per_worker_metrics_, and workers_mutex_.
◆ wait_time()
|
nodiscard |
Get the wait time histogram (read-only).
- Returns
- Reference to the wait time histogram.
Definition at line 174 of file enhanced_metrics.cpp.
References wait_time_.
◆ worker_metrics()
|
nodiscard |
Get per-worker metrics.
- Returns
- Vector of WorkerMetrics for each tracked worker.
Definition at line 178 of file enhanced_metrics.cpp.
References per_worker_metrics_, and workers_mutex_.
Member Data Documentation
◆ active_workers_
|
private |
Definition at line 426 of file enhanced_metrics.h.
Referenced by set_active_workers(), and snapshot().
◆ current_queue_depth_
|
private |
Definition at line 420 of file enhanced_metrics.h.
Referenced by record_queue_depth(), reset(), and snapshot().
◆ enqueue_latency_
|
private |
Definition at line 408 of file enhanced_metrics.h.
Referenced by enqueue_latency(), record_enqueue(), reset(), and snapshot().
◆ execution_latency_
|
private |
Definition at line 409 of file enhanced_metrics.h.
Referenced by execution_latency(), record_execution(), reset(), and snapshot().
◆ peak_queue_depth_
|
private |
Definition at line 421 of file enhanced_metrics.h.
Referenced by record_queue_depth(), reset(), and snapshot().
◆ per_worker_metrics_
|
private |
Definition at line 430 of file enhanced_metrics.h.
Referenced by EnhancedThreadPoolMetrics(), record_worker_state(), reset(), snapshot(), update_worker_count(), and worker_metrics().
◆ queue_depth_samples_
|
private |
Definition at line 423 of file enhanced_metrics.h.
Referenced by record_queue_depth(), reset(), and snapshot().
◆ queue_depth_sum_
|
private |
Definition at line 422 of file enhanced_metrics.h.
Referenced by record_queue_depth(), reset(), and snapshot().
◆ throughput_1m_
|
private |
Definition at line 414 of file enhanced_metrics.h.
Referenced by record_execution(), reset(), snapshot(), and throughput_1m().
◆ throughput_1s_
|
private |
Definition at line 413 of file enhanced_metrics.h.
Referenced by record_execution(), reset(), snapshot(), and throughput_1s().
◆ wait_time_
|
private |
Definition at line 410 of file enhanced_metrics.h.
Referenced by record_wait_time(), reset(), snapshot(), and wait_time().
◆ workers_mutex_
|
mutableprivate |
Definition at line 429 of file enhanced_metrics.h.
Referenced by record_worker_state(), reset(), snapshot(), update_worker_count(), and worker_metrics().
The documentation for this class was generated from the following files:
- include/kcenon/thread/metrics/enhanced_metrics.h
- src/metrics/enhanced_metrics.cpp