Monitoring System 0.1.0
System resource monitoring with pluggable collectors and alerting
Loading...
Searching...
No Matches
test_stress_performance.cpp File Reference

Stress testing for the monitoring system. More...

#include <gtest/gtest.h>
#include <thread>
#include <chrono>
#include <vector>
#include <atomic>
#include <random>
#include <memory>
#include <future>
#include <condition_variable>
#include <algorithm>
#include <numeric>
#include <fstream>
#include <filesystem>
#include <kcenon/monitoring/core/result_types.h>
#include <kcenon/monitoring/interfaces/monitoring_core.h>
#include <kcenon/monitoring/tracing/distributed_tracer.h>
#include <kcenon/monitoring/core/performance_monitor.h>
#include <kcenon/monitoring/adaptive/adaptive_monitor.h>
#include <kcenon/monitoring/health/health_monitor.h>
#include <kcenon/monitoring/reliability/circuit_breaker.h>
#include <kcenon/monitoring/reliability/fault_tolerance_manager.h>
#include <kcenon/monitoring/exporters/opentelemetry_adapter.h>
#include <kcenon/monitoring/storage/storage_backends.h>
Include dependency graph for test_stress_performance.cpp:

Go to the source code of this file.

Classes

class  StressPerformanceTest
 

Macros

#define RUNNING_WITH_ASAN   0
 

Functions

 TEST_F (StressPerformanceTest, HighLoadStressTest)
 
 TEST_F (StressPerformanceTest, MemoryLeakDetectionTest)
 
 TEST_F (StressPerformanceTest, ConcurrencyStressTest)
 
 TEST_F (StressPerformanceTest, ResourceExhaustionTest)
 
 TEST_F (StressPerformanceTest, SustainedLoadTest)
 
 TEST_F (StressPerformanceTest, BurstLoadTest)
 
 TEST_F (StressPerformanceTest, DeadlockDetectionTest)
 
 TEST_F (StressPerformanceTest, PerformanceDegradationTest)
 

Variables

constexpr double SANITIZER_OVERHEAD_FACTOR = 0 ? 2.0 : 1.0
 
constexpr bool IS_RELEASE_BUILD = false
 
constexpr double DEBUG_BUILD_OVERHEAD_FACTOR = IS_RELEASE_BUILD ? 1.0 : 2.0
 

Detailed Description

Stress testing for the monitoring system.

Tests system behavior under extreme conditions:

  • High load scenarios
  • Memory leak detection
  • Concurrency stress tests
  • Resource exhaustion handling
  • Performance degradation analysis

Definition in file test_stress_performance.cpp.

Macro Definition Documentation

◆ RUNNING_WITH_ASAN

#define RUNNING_WITH_ASAN   0

Definition at line 59 of file test_stress_performance.cpp.

Function Documentation

◆ TEST_F() [1/8]

TEST_F ( StressPerformanceTest ,
BurstLoadTest  )

Test 6: Burst Load Test Tests system response to sudden load spikes

Definition at line 458 of file test_stress_performance.cpp.

458 {
459 auto tracer = std::make_unique<distributed_tracer>();
460
461 const int BURST_SIZE = 10000;
462 const int NUM_BURSTS = 10;
463 const auto BURST_INTERVAL = 5s;
464
465 std::vector<double> burst_latencies;
466
467 for (int burst = 0; burst < NUM_BURSTS; ++burst) {
468 auto burst_start = std::chrono::high_resolution_clock::now();
469
470 // Generate burst of operations
471 std::vector<std::future<bool>> futures;
472 for (int i = 0; i < BURST_SIZE; ++i) {
473 futures.push_back(std::async(std::launch::async, [&tracer, i]() {
474 auto span = tracer->start_span("burst_op_" + std::to_string(i));
475 return span.is_ok();
476 }));
477 }
478
479 // Wait for burst to complete
480 int successful = 0;
481 for (auto& future : futures) {
482 if (future.get()) {
483 successful++;
484 }
485 }
486
487 auto burst_end = std::chrono::high_resolution_clock::now();
488 auto burst_duration = std::chrono::duration_cast<std::chrono::milliseconds>(
489 burst_end - burst_start).count();
490
491 burst_latencies.push_back(static_cast<double>(burst_duration));
492
493 std::cout << "Burst " << burst << ": " << successful << "/" << BURST_SIZE
494 << " successful, duration: " << burst_duration << "ms" << std::endl;
495
496 // Rest between bursts
497 std::this_thread::sleep_for(BURST_INTERVAL);
498 }
499
500 // Calculate statistics
501 double avg_latency = std::accumulate(burst_latencies.begin(), burst_latencies.end(), 0.0)
502 / burst_latencies.size();
503 double max_latency = *std::max_element(burst_latencies.begin(), burst_latencies.end());
504
505 std::cout << "\n=== Burst Load Test Results ===" << std::endl;
506 std::cout << "Average burst latency: " << avg_latency << "ms" << std::endl;
507 std::cout << "Max burst latency: " << max_latency << "ms" << std::endl;
508
509 // System should handle bursts efficiently
510 // Note: Thresholds adjusted for sanitizer overhead
511 const double avg_threshold = 5000 * SANITIZER_OVERHEAD_FACTOR;
512 const double max_threshold = 10000 * SANITIZER_OVERHEAD_FACTOR;
513 EXPECT_LT(avg_latency, avg_threshold); // Average under threshold
514 EXPECT_LT(max_latency, max_threshold); // Max under threshold
515}
constexpr double SANITIZER_OVERHEAD_FACTOR

References SANITIZER_OVERHEAD_FACTOR.

◆ TEST_F() [2/8]

TEST_F ( StressPerformanceTest ,
ConcurrencyStressTest  )

Test 3: Concurrency Stress Test Tests thread safety and race conditions

Definition at line 300 of file test_stress_performance.cpp.

300 {
301 const int NUM_THREADS = 50;
302 const int OPERATIONS = 1000;
303
304 // Shared resources
305 storage_config config;
306 config.type = storage_backend_type::memory_buffer;
307 config.max_capacity = 10000;
308 auto storage = std::make_unique<file_storage_backend>(config);
309
310 std::atomic<int> counter{0};
311 std::atomic<bool> race_detected{false};
312
313 // Synchronization for thread start
314 std::mutex start_mutex;
315 std::condition_variable start_cv;
316 std::atomic<int> ready_threads{0};
317 bool start_flag = false;
318
319 // Launch concurrent threads
320 std::vector<std::thread> threads;
321 for (int t = 0; t < NUM_THREADS; ++t) {
322 threads.emplace_back([&, t]() {
323 // Wait for all threads to be ready
324 {
325 std::unique_lock<std::mutex> lock(start_mutex);
326 ready_threads++;
327 if (ready_threads == NUM_THREADS) {
328 start_flag = true;
329 start_cv.notify_all();
330 } else {
331 start_cv.wait(lock, [&] { return start_flag; });
332 }
333 }
334
335 for (int i = 0; i < OPERATIONS; ++i) {
336 // Concurrent writes
337 metrics_snapshot snapshot;
338 snapshot.add_metric("thread_" + std::to_string(t), i);
339
340 auto result = storage->store(snapshot);
341 counter++;
342
343 // Check storage operation succeeded
344 if (!result.is_ok()) {
345 race_detected = true;
346 }
347 }
348 });
349 }
350
351 // Wait for completion
352 for (auto& thread : threads) {
353 thread.join();
354 }
355
356 // Verify results
357 EXPECT_FALSE(race_detected) << "Race condition detected";
358 EXPECT_EQ(counter, NUM_THREADS * OPERATIONS);
359 EXPECT_LE(storage->size(), config.max_capacity);
360}
@ counter
Monotonically increasing counter.
@ storage
Storage device sensor.
Complete snapshot of metrics at a point in time.
void add_metric(const std::string &name, double value)
Add a metric to the snapshot.

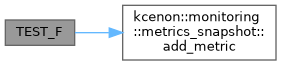
References kcenon::monitoring::metrics_snapshot::add_metric(), kcenon::monitoring::counter, kcenon::monitoring::storage_config::max_capacity, kcenon::monitoring::storage, and kcenon::monitoring::storage_config::type.

Here is the call graph for this function:

◆ TEST_F() [3/8]

TEST_F ( StressPerformanceTest ,
DeadlockDetectionTest  )

Test 7: Deadlock Detection Test Tests for potential deadlocks in concurrent operations

Definition at line 521 of file test_stress_performance.cpp.

521 {
522 const int NUM_THREADS = 10;
523 const int ITERATIONS = 100;
524
525 // Shared resources with potential for deadlock
526 std::timed_mutex mutex1, mutex2;
527 std::atomic<int> deadlock_timeouts{0};
528
529 std::vector<std::thread> threads;
530 for (int t = 0; t < NUM_THREADS; ++t) {
531 threads.emplace_back([&, t]() {
532 for (int i = 0; i < ITERATIONS; ++i) {
533 // Alternate lock order to create potential deadlock
534 if (t % 2 == 0) {
535 // Even threads: lock mutex1 then mutex2
536 if (mutex1.try_lock_for(100ms)) {
537 std::lock_guard<std::timed_mutex> lock1(mutex1, std::adopt_lock);
538 if (mutex2.try_lock_for(100ms)) {
539 std::lock_guard<std::timed_mutex> lock2(mutex2, std::adopt_lock);
540 // Critical section
541 std::this_thread::sleep_for(1ms);
542 } else {
543 deadlock_timeouts++;
544 }
545 } else {
546 deadlock_timeouts++;
547 }
548 } else {
549 // Odd threads: lock mutex2 then mutex1
550 if (mutex2.try_lock_for(100ms)) {
551 std::lock_guard<std::timed_mutex> lock2(mutex2, std::adopt_lock);
552 if (mutex1.try_lock_for(100ms)) {
553 std::lock_guard<std::timed_mutex> lock1(mutex1, std::adopt_lock);
554 // Critical section
555 std::this_thread::sleep_for(1ms);
556 } else {
557 deadlock_timeouts++;
558 }
559 } else {
560 deadlock_timeouts++;
561 }
562 }
563 }
564 });
565 }
566
567 // Set timeout for test
568 auto start = std::chrono::steady_clock::now();
569 bool all_finished = true;
570
571 for (auto& thread : threads) {
572 if (thread.joinable()) {
573 thread.join();
574 }
575
576 // Check if test is taking too long (potential deadlock)
577 if (std::chrono::steady_clock::now() - start > 30s) {
578 all_finished = false;
579 break;
580 }
581 }
582
583 EXPECT_TRUE(all_finished) << "Potential deadlock detected - test timed out";
584 std::cout << "Deadlock timeouts encountered: " << deadlock_timeouts << std::endl;
585}

◆ TEST_F() [4/8]

TEST_F ( StressPerformanceTest ,
HighLoadStressTest  )

Test 1: High Load Stress Test Tests system behavior under sustained high load

Definition at line 120 of file test_stress_performance.cpp.

120 {
121 // Windows CI runners have fewer cores and higher scheduling overhead,
122 // so use a reduced workload to avoid 30-second test timeouts.
123#if defined(_WIN32)
124 const int NUM_THREADS = 50;
125 const int OPERATIONS_PER_THREAD = 5000;
126 const auto TEST_DURATION = 60s;
127#else
128 const int NUM_THREADS = 100;
129 const int OPERATIONS_PER_THREAD = 10000;
130 const auto TEST_DURATION = 30s;
131#endif
132
133 // Setup components
134 auto tracer = std::make_unique<distributed_tracer>();
135 performance_monitor perf_monitor("stress_test");
136
137 // Metrics collection
138 std::atomic<int64_t> total_operations{0};
139 std::atomic<int64_t> failed_operations{0};
140 std::atomic<int64_t> total_latency_us{0};
141 std::vector<double> latencies;
142 std::mutex latency_mutex;
143
144 // Start time
145 auto start_time = std::chrono::steady_clock::now();
146
147 // Launch worker threads
148 std::vector<std::thread> workers;
149 for (int t = 0; t < NUM_THREADS; ++t) {
150 workers.emplace_back([&, t]() {
151 std::random_device rd;
152 std::mt19937 gen(rd());
153 std::uniform_int_distribution<> dis(1, 100);
154
155 for (int i = 0; i < OPERATIONS_PER_THREAD; ++i) {
156 auto op_start = std::chrono::high_resolution_clock::now();
157
158 // Create span
159 auto span_result = tracer->start_span(
160 "stress_op_" + std::to_string(t) + "_" + std::to_string(i));
161
162 if (span_result.is_ok()) {
163 // Simulate work
164 std::this_thread::sleep_for(std::chrono::microseconds(dis(gen)));
165
166 // Add attributes
167 span_result.value()->tags["thread_id"] = std::to_string(t);
168 span_result.value()->tags["operation_id"] = std::to_string(i);
169
170 total_operations++;
171 } else {
172 failed_operations++;
173 }
174
175 auto op_end = std::chrono::high_resolution_clock::now();
176 auto latency = std::chrono::duration_cast<std::chrono::microseconds>(
177 op_end - op_start).count();
178
179 total_latency_us += latency;
180
181 // Store latency for percentile calculation
182 {
183 std::lock_guard<std::mutex> lock(latency_mutex);
184 latencies.push_back(static_cast<double>(latency));
185 }
186
187 // Check if test duration exceeded
188 if (std::chrono::steady_clock::now() - start_time > TEST_DURATION) {
189 break;
190 }
191 }
192 });
193 }
194
195 // Wait for all workers
196 for (auto& worker : workers) {
197 worker.join();
198 }
199
200 // Calculate metrics
201 auto end_time = std::chrono::steady_clock::now();
202 auto duration = std::chrono::duration_cast<std::chrono::seconds>(end_time - start_time);
203
204 // Calculate percentiles
205 std::sort(latencies.begin(), latencies.end());
206 double p50 = latencies.empty() ? 0 : latencies[static_cast<size_t>(latencies.size() * 0.5)];
207 double p95 = latencies.empty() ? 0 : latencies[static_cast<size_t>(latencies.size() * 0.95)];
208 double p99 = latencies.empty() ? 0 : latencies[static_cast<size_t>(latencies.size() * 0.99)];
209
210 // Calculate throughput
211 double throughput = static_cast<double>(total_operations) / duration.count();
212 double avg_latency = static_cast<double>(total_latency_us) / total_operations;
213
214 // Output results
215 std::cout << "\n=== High Load Stress Test Results ===" << std::endl;
216 std::cout << "Duration: " << duration.count() << " seconds" << std::endl;
217 std::cout << "Total operations: " << total_operations << std::endl;
218 std::cout << "Failed operations: " << failed_operations << std::endl;
219 std::cout << "Throughput: " << throughput << " ops/sec" << std::endl;
220 std::cout << "Average latency: " << avg_latency << " μs" << std::endl;
221 std::cout << "P50 latency: " << p50 << " μs" << std::endl;
222 std::cout << "P95 latency: " << p95 << " μs" << std::endl;
223 std::cout << "P99 latency: " << p99 << " μs" << std::endl;
224
225 // Assertions
226 // Note: Thresholds adjusted for debug builds which run significantly slower
227 const double p99_threshold = 10000 * DEBUG_BUILD_OVERHEAD_FACTOR;
228 EXPECT_GT(throughput, 1000.0); // At least 1000 ops/sec
229 EXPECT_LT(failed_operations, total_operations * 0.01); // Less than 1% failure
230 EXPECT_LT(p99, p99_threshold); // P99 under threshold (10ms for Release, 20ms for Debug)
231}
Performance monitor combining profiling and system monitoring.
constexpr double DEBUG_BUILD_OVERHEAD_FACTOR

References DEBUG_BUILD_OVERHEAD_FACTOR.

◆ TEST_F() [5/8]

TEST_F ( StressPerformanceTest ,
MemoryLeakDetectionTest  )

Test 2: Memory Leak Detection Test Tests for memory leaks under repeated allocation/deallocation

Definition at line 237 of file test_stress_performance.cpp.

237 {
238 const int ITERATIONS = 1000;
239 const int OBJECTS_PER_ITERATION = 100;
240
241 // Track memory usage
242 std::vector<size_t> memory_samples;
243
244 for (int iter = 0; iter < ITERATIONS; ++iter) {
245 // Create and destroy many objects
246 std::vector<std::unique_ptr<distributed_tracer>> tracers;
247 std::vector<std::unique_ptr<circuit_breaker>> breakers;
248
249 circuit_breaker_config cb_config;
250 cb_config.failure_threshold = 3;
251 cb_config.timeout = 100ms;
252
253 for (int i = 0; i < OBJECTS_PER_ITERATION; ++i) {
254 tracers.push_back(std::make_unique<distributed_tracer>());
255 breakers.push_back(std::make_unique<circuit_breaker>(cb_config));
256
257 // Create spans
258 auto span = tracers.back()->start_span("test_span_" + std::to_string(i));
259 if (span.is_ok()) {
260 span.value()->tags["iteration"] = std::to_string(iter);
261 }
262 }
263
264 // Clear objects (should free memory)
265 tracers.clear();
266 breakers.clear();
267
268 // Sample memory usage periodically
269 if (iter % 100 == 0) {
270 memory_samples.push_back(GetCurrentMemoryUsage());
271 }
272 }
273
274 // Analyze memory trend
275 if (memory_samples.size() > 2) {
276 // Check if memory is growing linearly (indicates leak)
277 double correlation = 0;
278 double mean_x = memory_samples.size() / 2.0;
279 double mean_y = std::accumulate(memory_samples.begin(), memory_samples.end(), 0.0) / memory_samples.size();
280
281 double sum_xy = 0, sum_xx = 0;
282 for (size_t i = 0; i < memory_samples.size(); ++i) {
283 sum_xy += (i - mean_x) * (memory_samples[i] - mean_y);
284 sum_xx += (i - mean_x) * (i - mean_x);
285 }
286
287 if (sum_xx > 0) {
288 correlation = sum_xy / sqrt(sum_xx);
289 }
290
291 // High positive correlation indicates memory leak
292 EXPECT_LT(correlation, 0.8) << "Potential memory leak detected";
293 }
294}
common::resilience::circuit_breaker_config circuit_breaker_config

◆ TEST_F() [6/8]

TEST_F ( StressPerformanceTest ,
PerformanceDegradationTest  )

Test 8: Performance Degradation Test Tests how performance degrades under increasing load

Definition at line 591 of file test_stress_performance.cpp.

591 {
592 auto tracer = std::make_unique<distributed_tracer>();
593
594 struct LoadLevel {
595 int threads;
596 int operations;
597 double avg_latency;
598 double throughput;
599 };
600
601 std::vector<LoadLevel> load_levels = {
602 {1, 1000, 0, 0},
603 {5, 1000, 0, 0},
604 {10, 1000, 0, 0},
605 {20, 1000, 0, 0},
606 {50, 1000, 0, 0},
607 {100, 1000, 0, 0}
608 };
609
610 for (auto& level : load_levels) {
611 std::atomic<int64_t> total_latency_us{0};
612 std::atomic<int> completed_ops{0};
613
614 auto start_time = std::chrono::high_resolution_clock::now();
615
616 std::vector<std::thread> threads;
617 for (int t = 0; t < level.threads; ++t) {
618 threads.emplace_back([&]() {
619 for (int i = 0; i < level.operations / level.threads; ++i) {
620 auto op_start = std::chrono::high_resolution_clock::now();
621
622 auto span = tracer->start_span("degradation_op");
623 if (span.is_ok()) {
624 span.value()->tags["load_level"] = std::to_string(level.threads);
625 completed_ops++;
626 }
627
628 auto op_end = std::chrono::high_resolution_clock::now();
629 total_latency_us += std::chrono::duration_cast<std::chrono::microseconds>(
630 op_end - op_start).count();
631 }
632 });
633 }
634
635 for (auto& thread : threads) {
636 thread.join();
637 }
638
639 auto end_time = std::chrono::high_resolution_clock::now();
640 auto duration = std::chrono::duration_cast<std::chrono::milliseconds>(
641 end_time - start_time).count();
642
643 level.avg_latency = static_cast<double>(total_latency_us) / completed_ops;
644 level.throughput = (completed_ops * 1000.0) / duration;
645
646 std::cout << "Load level " << level.threads << " threads: "
647 << "throughput=" << level.throughput << " ops/sec, "
648 << "avg_latency=" << level.avg_latency << " μs" << std::endl;
649 }
650
651 // Check for graceful degradation
652 // Verify all load levels completed successfully
653 for (const auto& level : load_levels) {
654 EXPECT_GT(level.throughput, 0) << "Load level " << level.threads
655 << " should have non-zero throughput";
656 EXPECT_GT(level.avg_latency, 0) << "Load level " << level.threads
657 << " should have measurable latency";
658 }
659
660 // Verify we can handle maximum load (100 threads)
661 EXPECT_GT(load_levels.back().throughput, 10000.0)
662 << "System should maintain >10K ops/sec at high load";
663}

◆ TEST_F() [7/8]

TEST_F ( StressPerformanceTest ,
ResourceExhaustionTest  )

Test 4: Resource Exhaustion Test Tests behavior when resources are exhausted

Definition at line 366 of file test_stress_performance.cpp.

366 {
367 // Create storage with small capacity
368 storage_config config;
369 config.type = storage_backend_type::memory_buffer;
370 config.max_capacity = 100; // Small capacity
371 auto storage = std::make_unique<file_storage_backend>(config);
372
373 // Track results
374 int successful_stores = 0;
375
376 // Try to store more than capacity
377 for (int i = 0; i < 1000; ++i) {
378 metrics_snapshot snapshot;
379 snapshot.add_metric("test_metric", i);
380
381 auto result = storage->store(snapshot);
382 if (result.is_ok()) {
383 successful_stores++;
384 }
385 }
386
387 // Storage should handle capacity by evicting old data
388 // All stores should succeed as old entries are removed
389 EXPECT_EQ(successful_stores, 1000);
390 // Size should be limited to max_capacity
391 EXPECT_EQ(storage->size(), config.max_capacity);
392}

References kcenon::monitoring::metrics_snapshot::add_metric(), kcenon::monitoring::storage_config::max_capacity, kcenon::monitoring::storage, and kcenon::monitoring::storage_config::type.

Here is the call graph for this function:

◆ TEST_F() [8/8]

TEST_F ( StressPerformanceTest ,
SustainedLoadTest  )

Test 5: Sustained Load Test Tests system stability under sustained moderate load

Definition at line 398 of file test_stress_performance.cpp.

398 {
399 const auto TEST_DURATION = 5s; // Reduced to 5 seconds for faster testing
400 const int NUM_THREADS = 10;
401 const int OPS_PER_CYCLE = 100;
402
403 auto tracer = std::make_unique<distributed_tracer>();
404
405 std::atomic<int64_t> total_operations{0};
406 std::atomic<int64_t> failed_operations{0};
407
408 // Worker threads
409 std::vector<std::thread> workers;
410 auto start_time = std::chrono::steady_clock::now();
411
412 for (int t = 0; t < NUM_THREADS; ++t) {
413 workers.emplace_back([&, t]() {
414 while (std::chrono::steady_clock::now() - start_time < TEST_DURATION) {
415 // Perform operations
416 for (int i = 0; i < OPS_PER_CYCLE; ++i) {
417 auto span = tracer->start_span("sustained_op");
418 if (span.is_ok()) {
419 span.value()->tags["thread"] = std::to_string(t);
420 total_operations++;
421 } else {
422 failed_operations++;
423 }
424 }
425
426 // Small sleep to prevent CPU overload
427 std::this_thread::sleep_for(10ms);
428 }
429 });
430 }
431
432 // Wait for workers
433 for (auto& worker : workers) {
434 worker.join();
435 }
436
437 // Calculate results
438 auto duration = std::chrono::duration_cast<std::chrono::milliseconds>(
439 std::chrono::steady_clock::now() - start_time);
440 double avg_throughput = (static_cast<double>(total_operations) * 1000.0) / duration.count();
441
442 std::cout << "\n=== Sustained Load Test Results ===" << std::endl;
443 std::cout << "Duration: " << duration.count() << " ms" << std::endl;
444 std::cout << "Total operations: " << total_operations << std::endl;
445 std::cout << "Failed operations: " << failed_operations << std::endl;
446 std::cout << "Average throughput: " << avg_throughput << " ops/sec" << std::endl;
447
448 // System should remain stable with minimal failures
449 EXPECT_EQ(failed_operations, 0);
450 EXPECT_GT(total_operations, 0);
451 EXPECT_GT(avg_throughput, 1000.0); // At least 1000 ops/sec
452}

Variable Documentation

◆ DEBUG_BUILD_OVERHEAD_FACTOR

double DEBUG_BUILD_OVERHEAD_FACTOR = IS_RELEASE_BUILD ? 1.0 : 2.0
constexpr

Definition at line 74 of file test_stress_performance.cpp.

Referenced by TEST_F().

◆ IS_RELEASE_BUILD

bool IS_RELEASE_BUILD = false
constexpr

Definition at line 70 of file test_stress_performance.cpp.

◆ SANITIZER_OVERHEAD_FACTOR

double SANITIZER_OVERHEAD_FACTOR = 0 ? 2.0 : 1.0
constexpr

Definition at line 63 of file test_stress_performance.cpp.

Referenced by TEST_F().