Example demonstrating custom metric types: histogram, summary, and timer. More...
#include <iostream>#include <iomanip>#include <thread>#include <chrono>#include <random>#include <vector>#include "kcenon/monitoring/utils/metric_types.h"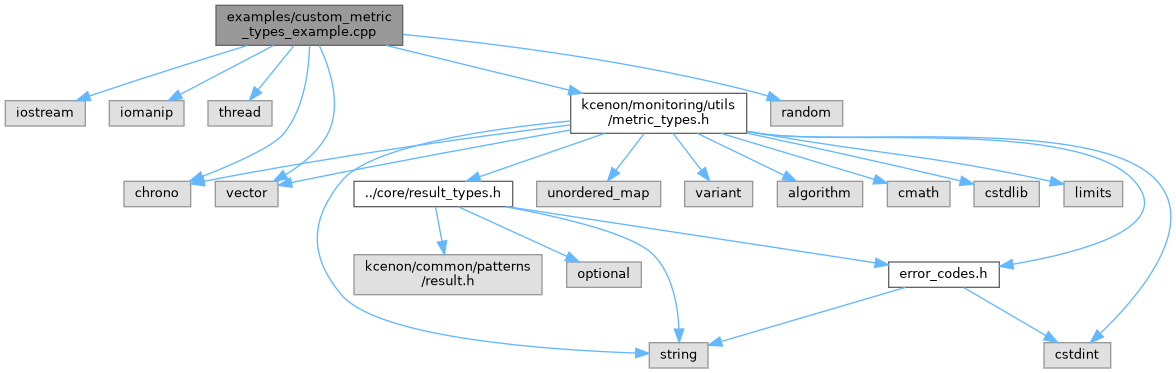
Go to the source code of this file.
Functions | |
| double | simulate_api_call (std::mt19937 &rng) |
| void | demonstrate_histogram () |
| void | demonstrate_summary () |
| void | demonstrate_timer () |
| void | demonstrate_timer_scope () |
| void | demonstrate_metric_metadata () |
| void | demonstrate_metric_batch () |
| int | main () |
Detailed Description
Example demonstrating custom metric types: histogram, summary, and timer.
Definition in file custom_metric_types_example.cpp.
Function Documentation
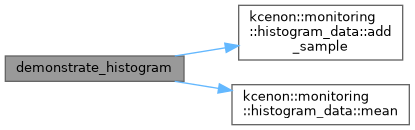
◆ demonstrate_histogram()
| void demonstrate_histogram | ( | ) |
- Examples
- custom_metric_types_example.cpp.
Definition at line 49 of file custom_metric_types_example.cpp.
References kcenon::monitoring::histogram_data::add_sample(), kcenon::monitoring::histogram_data::buckets, kcenon::monitoring::histogram_data::mean(), kcenon::monitoring::histogram_data::sum, and kcenon::monitoring::histogram_data::total_count.
Referenced by main().

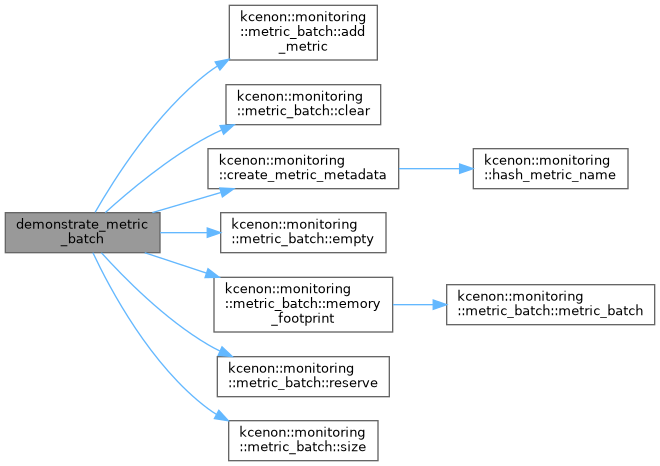
◆ demonstrate_metric_batch()
| void demonstrate_metric_batch | ( | ) |
- Examples
- custom_metric_types_example.cpp.
Definition at line 222 of file custom_metric_types_example.cpp.
References kcenon::monitoring::metric_batch::add_metric(), kcenon::monitoring::metric_batch::batch_id, kcenon::monitoring::metric_batch::clear(), kcenon::monitoring::create_metric_metadata(), kcenon::monitoring::metric_batch::empty(), kcenon::monitoring::metric_batch::memory_footprint(), kcenon::monitoring::metric_batch::reserve(), and kcenon::monitoring::metric_batch::size().
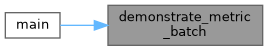
Referenced by main().
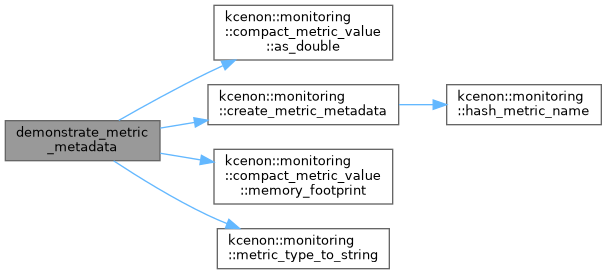
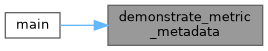
◆ demonstrate_metric_metadata()
| void demonstrate_metric_metadata | ( | ) |
- Examples
- custom_metric_types_example.cpp.
Definition at line 186 of file custom_metric_types_example.cpp.
References kcenon::monitoring::compact_metric_value::as_double(), kcenon::monitoring::create_metric_metadata(), kcenon::monitoring::compact_metric_value::memory_footprint(), and kcenon::monitoring::metric_type_to_string().
Referenced by main().
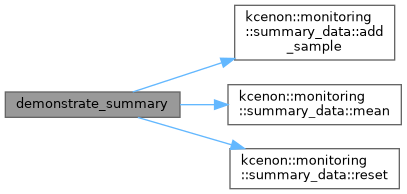
◆ demonstrate_summary()
| void demonstrate_summary | ( | ) |
- Examples
- custom_metric_types_example.cpp.
Definition at line 94 of file custom_metric_types_example.cpp.
References kcenon::monitoring::summary_data::add_sample(), kcenon::monitoring::summary_data::count, kcenon::monitoring::summary_data::max_value, kcenon::monitoring::summary_data::mean(), kcenon::monitoring::summary_data::min_value, kcenon::monitoring::summary_data::reset(), and kcenon::monitoring::summary_data::sum.
Referenced by main().

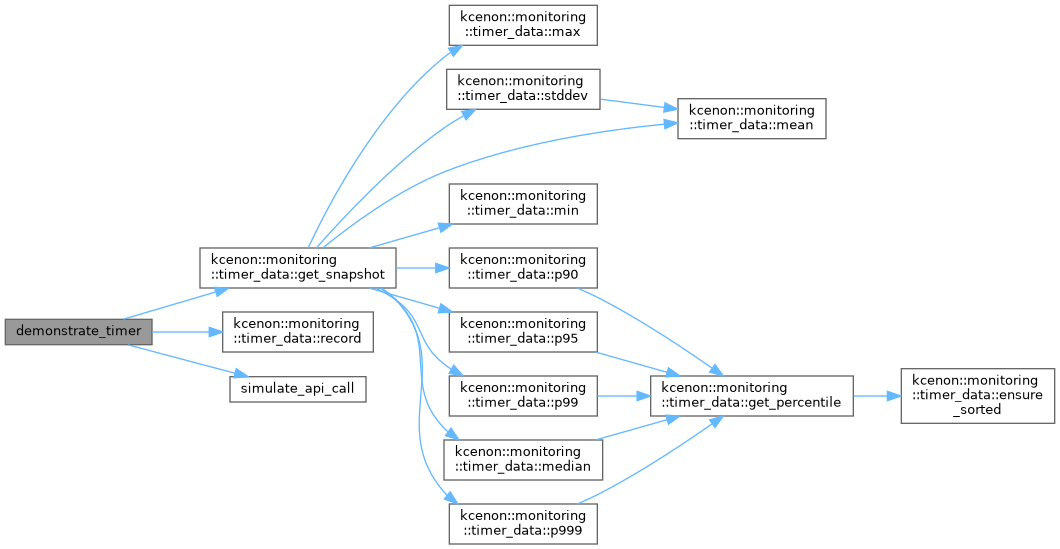
◆ demonstrate_timer()
| void demonstrate_timer | ( | ) |
- Examples
- custom_metric_types_example.cpp.
Definition at line 125 of file custom_metric_types_example.cpp.
References kcenon::monitoring::timer_data::snapshot::count, kcenon::monitoring::timer_data::get_snapshot(), kcenon::monitoring::timer_data::record(), and simulate_api_call().
Referenced by main().

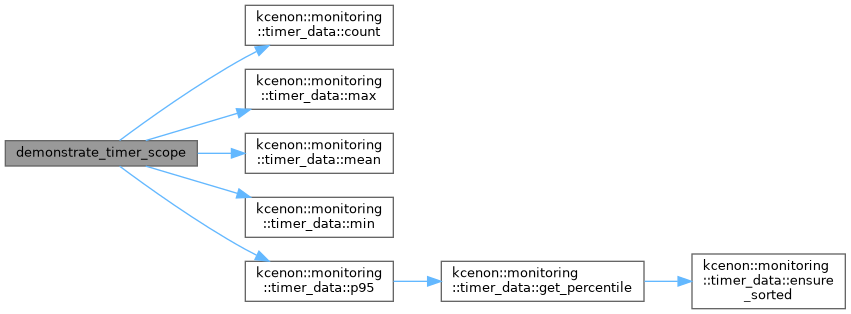
◆ demonstrate_timer_scope()
| void demonstrate_timer_scope | ( | ) |
- Examples
- custom_metric_types_example.cpp.
Definition at line 159 of file custom_metric_types_example.cpp.
References kcenon::monitoring::timer_data::count(), kcenon::monitoring::timer_data::max(), kcenon::monitoring::timer_data::mean(), kcenon::monitoring::timer_data::min(), and kcenon::monitoring::timer_data::p95().
Referenced by main().

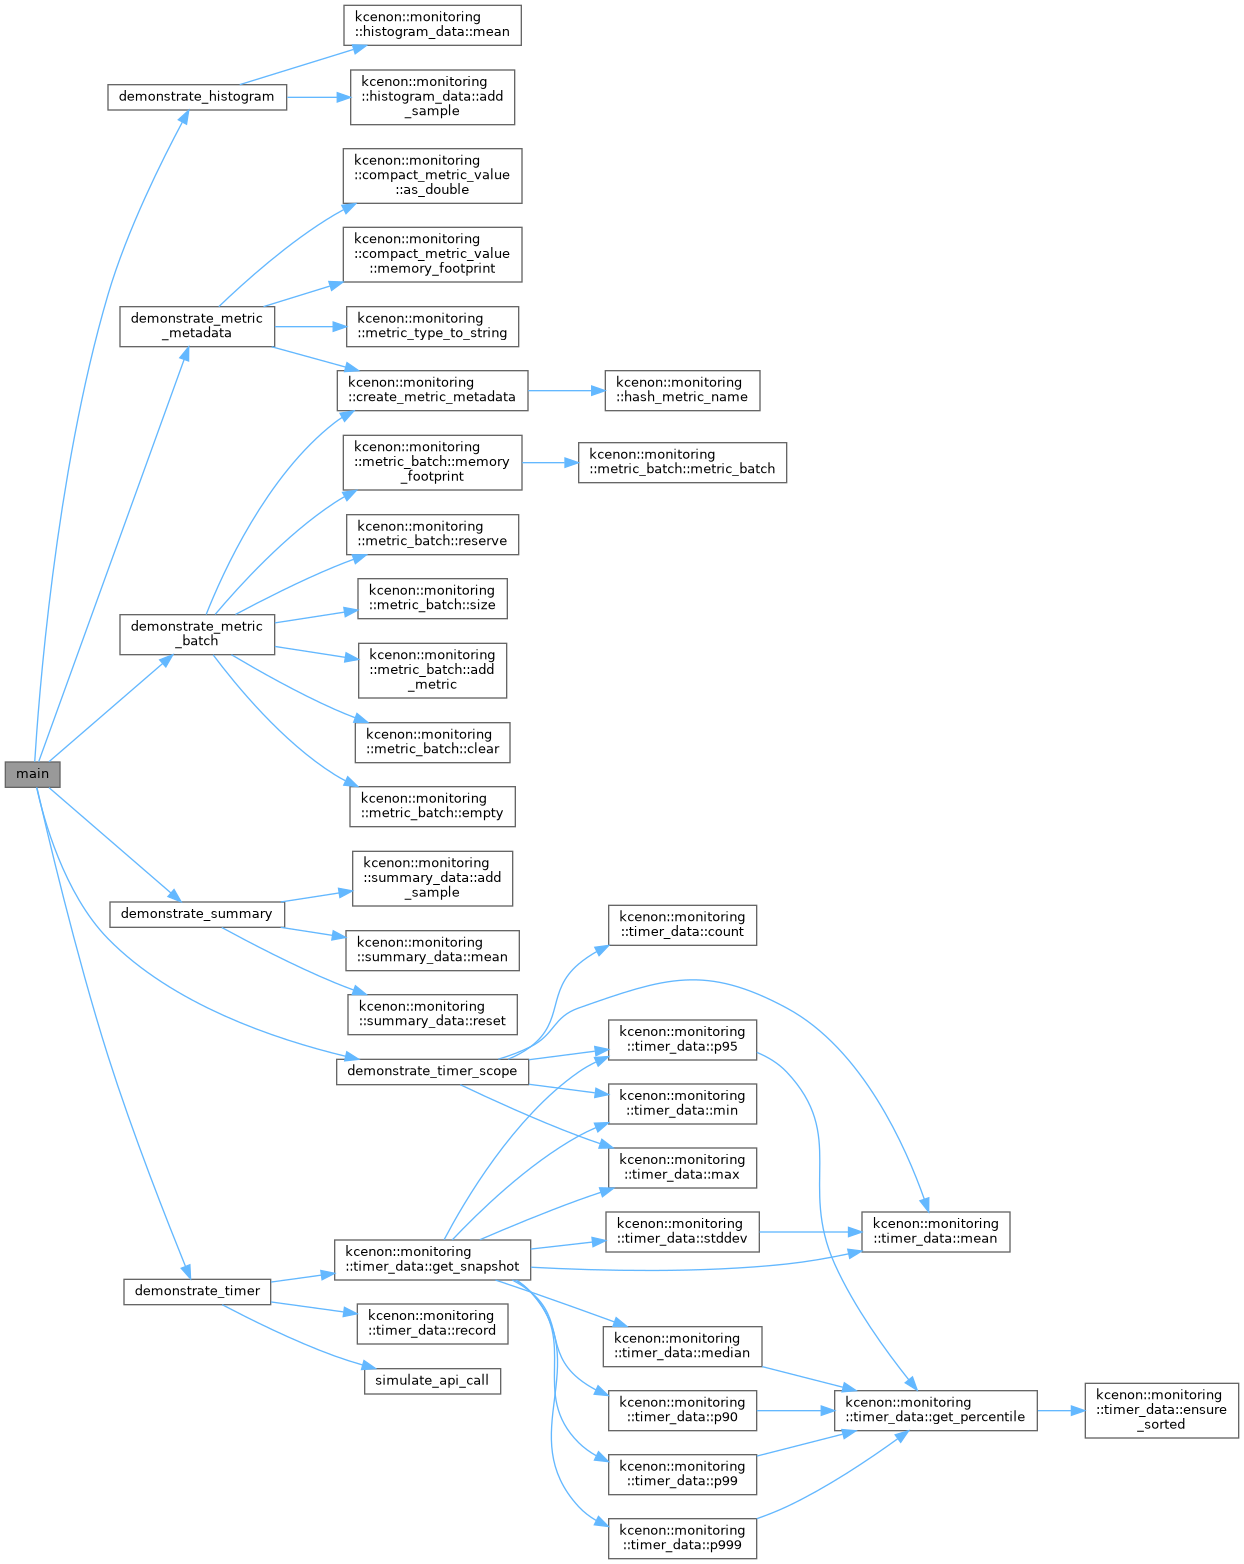
◆ main()
| int main | ( | ) |
Definition at line 252 of file custom_metric_types_example.cpp.
References demonstrate_histogram(), demonstrate_metric_batch(), demonstrate_metric_metadata(), demonstrate_summary(), demonstrate_timer(), and demonstrate_timer_scope().
◆ simulate_api_call()
| double simulate_api_call | ( | std::mt19937 & | rng | ) |
- Examples
- custom_metric_types_example.cpp.
Definition at line 30 of file custom_metric_types_example.cpp.
Referenced by demonstrate_timer().
