Monitoring system integration example with Result pattern. More...
#include <kcenon/monitoring/core/performance_monitor.h>#include <kcenon/monitoring/core/result_types.h>#include <kcenon/common/interfaces/logger_interface.h>#include <kcenon/common/interfaces/monitoring_interface.h>#include <iostream>#include <memory>#include <thread>#include <chrono>#include <iomanip>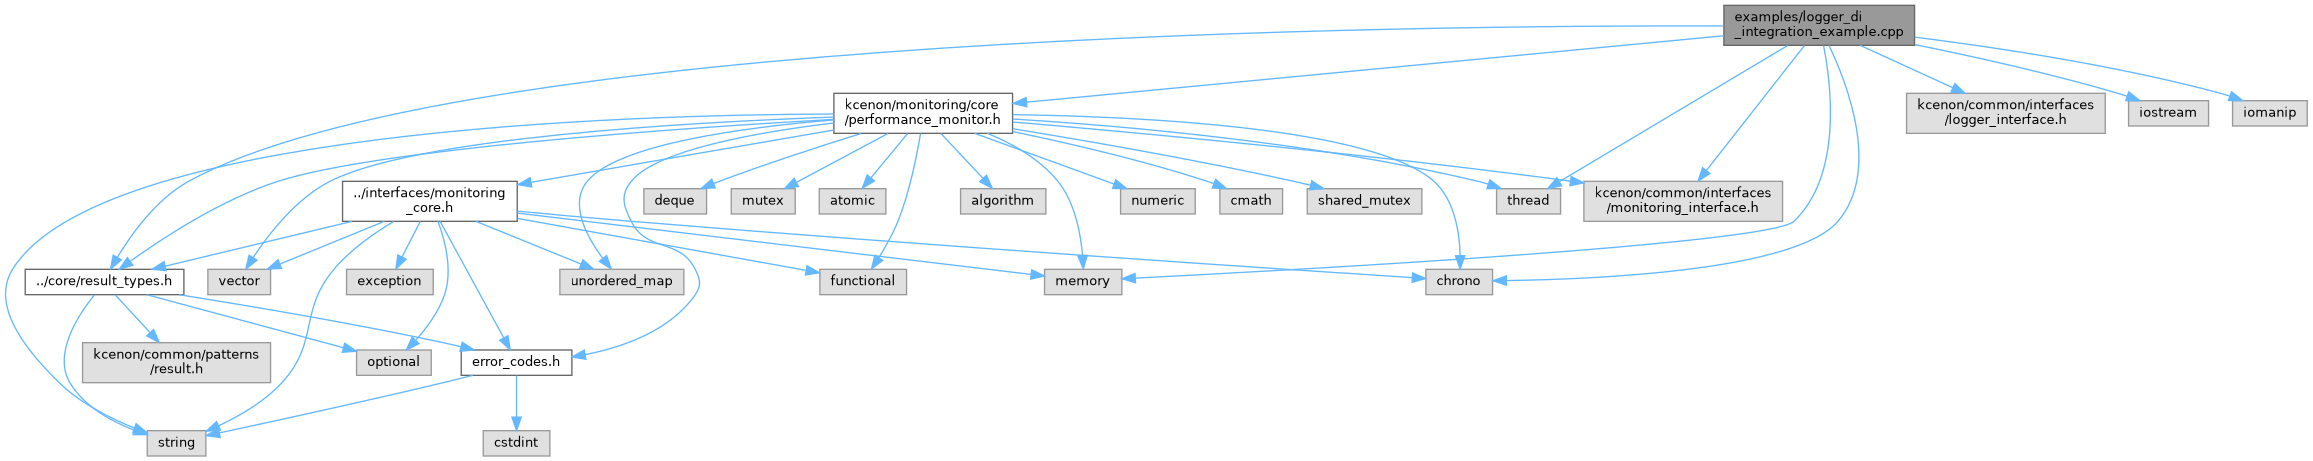
Go to the source code of this file.
Classes | |
| class | simple_console_logger |
| Simple logger implementation for demonstration. More... | |
Functions | |
| void | example_1_basic_monitoring () |
| Example 1: Basic monitoring with Result pattern. | |
| void | example_2_error_handling () |
| Example 2: Error handling with Result pattern. | |
| void | example_3_threshold_monitoring () |
| Example 3: Threshold monitoring. | |
| void | example_4_multiple_monitors () |
| Example 4: Multiple monitors. | |
| void | example_5_metrics_with_tags () |
| Example 5: Metrics with tags. | |
| void | example_6_monitoring_workflow () |
| Example 6: Simulating monitoring workflow. | |
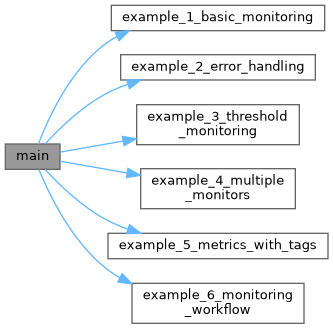
| int | main () |
Detailed Description
Monitoring system integration example with Result pattern.
Definition in file logger_di_integration_example.cpp.
Function Documentation
◆ example_1_basic_monitoring()
| void example_1_basic_monitoring | ( | ) |
Example 1: Basic monitoring with Result pattern.
- Examples
- logger_di_integration_example.cpp.
Definition at line 95 of file logger_di_integration_example.cpp.
Referenced by main().

◆ example_2_error_handling()
| void example_2_error_handling | ( | ) |
Example 2: Error handling with Result pattern.
- Examples
- logger_di_integration_example.cpp.
Definition at line 125 of file logger_di_integration_example.cpp.
Referenced by main().

◆ example_3_threshold_monitoring()
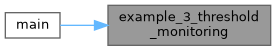
| void example_3_threshold_monitoring | ( | ) |
Example 3: Threshold monitoring.
- Examples
- logger_di_integration_example.cpp.
Definition at line 143 of file logger_di_integration_example.cpp.
Referenced by main().
◆ example_4_multiple_monitors()
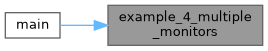
| void example_4_multiple_monitors | ( | ) |
Example 4: Multiple monitors.
- Examples
- logger_di_integration_example.cpp.
Definition at line 171 of file logger_di_integration_example.cpp.
Referenced by main().
◆ example_5_metrics_with_tags()
| void example_5_metrics_with_tags | ( | ) |
Example 5: Metrics with tags.
- Examples
- logger_di_integration_example.cpp.
Definition at line 199 of file logger_di_integration_example.cpp.
Referenced by main().

◆ example_6_monitoring_workflow()
| void example_6_monitoring_workflow | ( | ) |
Example 6: Simulating monitoring workflow.
- Examples
- logger_di_integration_example.cpp.
Definition at line 224 of file logger_di_integration_example.cpp.
Referenced by main().
◆ main()
| int main | ( | ) |
Definition at line 259 of file logger_di_integration_example.cpp.
References example_1_basic_monitoring(), example_2_error_handling(), example_3_threshold_monitoring(), example_4_multiple_monitors(), example_5_metrics_with_tags(), and example_6_monitoring_workflow().