#include <gtest/gtest.h>#include <chrono>#include <string>#include <vector>#include <atomic>#include <thread>#include "database/monitoring/performance_monitor.h"#include "database/monitoring/pool_metrics.h"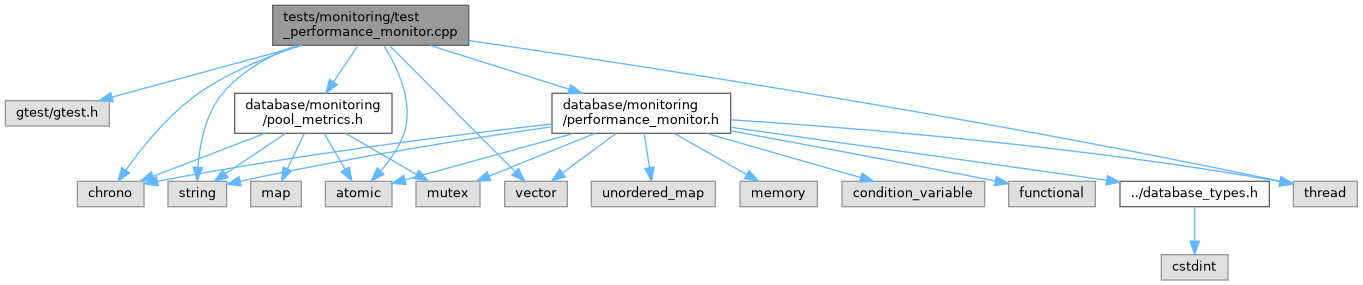
Go to the source code of this file.
Classes | |
| class | PerformanceMonitorQueryTest |
| class | MonitoringEnabledTest |
| class | FilteredSummaryTest |
| class | QueryHistoryTest |
| class | AlertSystemTest |
| class | MetricLifecycleTest |
| class | ConnectionMetricsTest |
| class | MetricsOutputTest |
| class | PerformanceAlertTest |
| class | PoolMetricsTest |
| class | PrometheusExporterTest |
| class | QueryTimerTest |
Functions | |
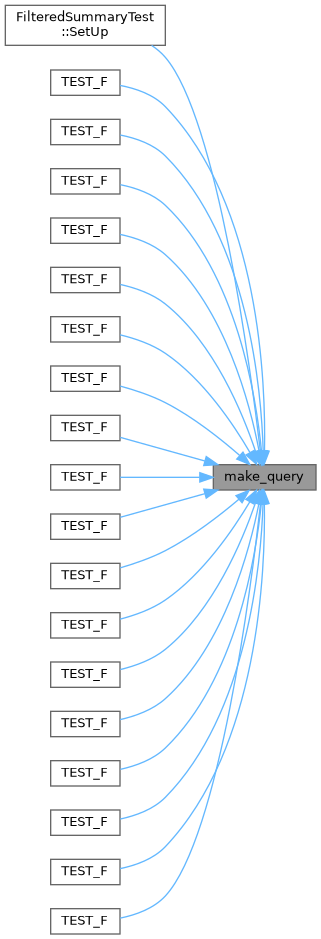
| static query_metrics | make_query (const std::string &hash, std::chrono::microseconds exec_time, bool success, database_types db_type=database_types::postgres, const std::string &error_msg="") |
| TEST_F (PerformanceMonitorQueryTest, RecordAndRetrieveSingleQuery) | |
| TEST_F (PerformanceMonitorQueryTest, RecordMultipleQueries) | |
| TEST_F (PerformanceMonitorQueryTest, AvgQueryTimeCalculation) | |
| TEST_F (MonitoringEnabledTest, DisabledDoesNotRecordQueryMetrics) | |
| TEST_F (MonitoringEnabledTest, DisabledDoesNotRecordConnectionMetrics) | |
| TEST_F (MonitoringEnabledTest, DisabledDoesNotUpdateConnectionCount) | |
| TEST_F (MonitoringEnabledTest, ReEnableResumesRecording) | |
| TEST_F (FilteredSummaryTest, PostgresSummaryFiltersCorrectly) | |
| TEST_F (FilteredSummaryTest, SqliteSummaryFiltersCorrectly) | |
| TEST_F (FilteredSummaryTest, UnusedDbTypeReturnsZero) | |
| TEST_F (FilteredSummaryTest, OverallSummaryIncludesAll) | |
| TEST_F (QueryHistoryTest, GetRecentQueriesWithinWindow) | |
| TEST_F (QueryHistoryTest, GetRecentQueriesEmptyWindow) | |
| TEST_F (QueryHistoryTest, GetSlowQueriesAboveThreshold) | |
| TEST_F (QueryHistoryTest, GetSlowQueriesNoneAboveThreshold) | |
| TEST_F (QueryHistoryTest, GetSlowQueriesPreservesMetadata) | |
| TEST_F (AlertSystemTest, SlowQueryTriggersAlert) | |
| TEST_F (AlertSystemTest, RegisterAlertHandlerReceivesCallback) | |
| TEST_F (AlertSystemTest, MultipleHandlersAllCalled) | |
| TEST_F (AlertSystemTest, GetRecentAlertsEmptyByDefault) | |
| TEST_F (AlertSystemTest, RecordSlowQueryEmitsAlert) | |
| TEST_F (AlertSystemTest, ConnectionPoolExhaustionAlert) | |
| TEST_F (MetricLifecycleTest, ClearMetricsRemovesEverything) | |
| TEST_F (MetricLifecycleTest, CleanupOldMetricsRemovesExpired) | |
| TEST_F (MetricLifecycleTest, CleanupKeepsRecentMetrics) | |
| TEST_F (ConnectionMetricsTest, UpdateConnectionCountStoresValues) | |
| TEST_F (ConnectionMetricsTest, GetConnectionMetricsUnknownDbType) | |
| TEST_F (ConnectionMetricsTest, ConnectionSummaryIncludesMultipleTypes) | |
| TEST_F (MetricsOutputTest, GetMetricsJsonContainsFields) | |
| TEST_F (MetricsOutputTest, GetMetricsJsonEmptyMonitor) | |
| TEST_F (PerformanceAlertTest, ConstructionAndAccessors) | |
| TEST_F (PerformanceAlertTest, AllAlertTypes) | |
| TEST_F (PoolMetricsTest, InitialStateIsZero) | |
| TEST_F (PoolMetricsTest, RecordSuccessfulAcquisition) | |
| TEST_F (PoolMetricsTest, RecordFailedAcquisition) | |
| TEST_F (PoolMetricsTest, RecordMultipleAcquisitionsTracksMinMax) | |
| TEST_F (PoolMetricsTest, RecordTimeout) | |
| TEST_F (PoolMetricsTest, UpdateActiveTracksPeak) | |
| TEST_F (PoolMetricsTest, UpdateQueuedTracksPeak) | |
| TEST_F (PoolMetricsTest, RecordHealthCheck) | |
| TEST_F (PoolMetricsTest, AverageWaitTime) | |
| TEST_F (PoolMetricsTest, AverageWaitTimeZeroWhenNoAcquisitions) | |
| TEST_F (PoolMetricsTest, SuccessRate) | |
| TEST_F (PoolMetricsTest, SuccessRateNoAcquisitions) | |
| TEST_F (PoolMetricsTest, ResetClearsStatistics) | |
| TEST_F (PrometheusExporterTest, FormatContainsMetricNames) | |
| TEST_F (PrometheusExporterTest, ExportMetricsReturnsTrue) | |
| TEST_F (PrometheusExporterTest, ExportAlertsReturnsTrue) | |
| TEST_F (QueryTimerTest, DestructorRecordsMetrics) | |
| TEST_F (QueryTimerTest, SetErrorMarksFailure) | |
| TEST_F (QueryTimerTest, SetRowsAffected) | |
Function Documentation
◆ make_query()
|
static |
Definition at line 27 of file test_performance_monitor.cpp.
References database::monitoring::query_metrics::db_type, database::monitoring::query_metrics::end_time, database::monitoring::query_metrics::error_message, database::monitoring::query_metrics::execution_time, database::monitoring::query_metrics::query_hash, database::monitoring::query_metrics::rows_affected, database::monitoring::query_metrics::start_time, database::success, and database::monitoring::query_metrics::success.
Referenced by FilteredSummaryTest::SetUp(), TEST_F(), TEST_F(), TEST_F(), TEST_F(), TEST_F(), TEST_F(), TEST_F(), TEST_F(), TEST_F(), TEST_F(), TEST_F(), TEST_F(), TEST_F(), TEST_F(), TEST_F(), TEST_F(), TEST_F(), and TEST_F().
◆ TEST_F() [1/51]
| TEST_F | ( | AlertSystemTest | , |
| ConnectionPoolExhaustionAlert | ) |
Definition at line 346 of file test_performance_monitor.cpp.
References database::monitoring::connection_metrics::active_connections, and database::monitoring::connection_metrics::total_connections.
◆ TEST_F() [2/51]
| TEST_F | ( | AlertSystemTest | , |
| GetRecentAlertsEmptyByDefault | ) |
Definition at line 332 of file test_performance_monitor.cpp.
◆ TEST_F() [3/51]
| TEST_F | ( | AlertSystemTest | , |
| MultipleHandlersAllCalled | ) |
Definition at line 313 of file test_performance_monitor.cpp.
References make_query().

◆ TEST_F() [4/51]
| TEST_F | ( | AlertSystemTest | , |
| RecordSlowQueryEmitsAlert | ) |
Definition at line 337 of file test_performance_monitor.cpp.
◆ TEST_F() [5/51]
| TEST_F | ( | AlertSystemTest | , |
| RegisterAlertHandlerReceivesCallback | ) |
Definition at line 299 of file test_performance_monitor.cpp.
References make_query().

◆ TEST_F() [6/51]
| TEST_F | ( | AlertSystemTest | , |
| SlowQueryTriggersAlert | ) |
Definition at line 279 of file test_performance_monitor.cpp.
References make_query().

◆ TEST_F() [7/51]
| TEST_F | ( | ConnectionMetricsTest | , |
| ConnectionSummaryIncludesMultipleTypes | ) |
Definition at line 444 of file test_performance_monitor.cpp.
References make_query().

◆ TEST_F() [8/51]
| TEST_F | ( | ConnectionMetricsTest | , |
| GetConnectionMetricsUnknownDbType | ) |
Definition at line 438 of file test_performance_monitor.cpp.
◆ TEST_F() [9/51]
| TEST_F | ( | ConnectionMetricsTest | , |
| UpdateConnectionCountStoresValues | ) |
Definition at line 430 of file test_performance_monitor.cpp.
◆ TEST_F() [10/51]
| TEST_F | ( | FilteredSummaryTest | , |
| OverallSummaryIncludesAll | ) |
Definition at line 193 of file test_performance_monitor.cpp.
◆ TEST_F() [11/51]
| TEST_F | ( | FilteredSummaryTest | , |
| PostgresSummaryFiltersCorrectly | ) |
Definition at line 173 of file test_performance_monitor.cpp.
◆ TEST_F() [12/51]
| TEST_F | ( | FilteredSummaryTest | , |
| SqliteSummaryFiltersCorrectly | ) |
Definition at line 180 of file test_performance_monitor.cpp.
◆ TEST_F() [13/51]
| TEST_F | ( | FilteredSummaryTest | , |
| UnusedDbTypeReturnsZero | ) |
Definition at line 188 of file test_performance_monitor.cpp.
◆ TEST_F() [14/51]
| TEST_F | ( | MetricLifecycleTest | , |
| CleanupKeepsRecentMetrics | ) |
Definition at line 405 of file test_performance_monitor.cpp.
References make_query().

◆ TEST_F() [15/51]
| TEST_F | ( | MetricLifecycleTest | , |
| CleanupOldMetricsRemovesExpired | ) |
Definition at line 392 of file test_performance_monitor.cpp.
References make_query().

◆ TEST_F() [16/51]
| TEST_F | ( | MetricLifecycleTest | , |
| ClearMetricsRemovesEverything | ) |
Definition at line 376 of file test_performance_monitor.cpp.
References make_query().

◆ TEST_F() [17/51]
| TEST_F | ( | MetricsOutputTest | , |
| GetMetricsJsonContainsFields | ) |
Definition at line 472 of file test_performance_monitor.cpp.
References make_query().

◆ TEST_F() [18/51]
| TEST_F | ( | MetricsOutputTest | , |
| GetMetricsJsonEmptyMonitor | ) |
Definition at line 485 of file test_performance_monitor.cpp.
◆ TEST_F() [19/51]
| TEST_F | ( | MonitoringEnabledTest | , |
| DisabledDoesNotRecordConnectionMetrics | ) |
Definition at line 117 of file test_performance_monitor.cpp.
References database::monitoring::connection_metrics::active_connections, and database::monitoring::connection_metrics::total_connections.
◆ TEST_F() [20/51]
| TEST_F | ( | MonitoringEnabledTest | , |
| DisabledDoesNotRecordQueryMetrics | ) |
Definition at line 108 of file test_performance_monitor.cpp.
References make_query().

◆ TEST_F() [21/51]
| TEST_F | ( | MonitoringEnabledTest | , |
| DisabledDoesNotUpdateConnectionCount | ) |
Definition at line 129 of file test_performance_monitor.cpp.
◆ TEST_F() [22/51]
| TEST_F | ( | MonitoringEnabledTest | , |
| ReEnableResumesRecording | ) |
Definition at line 137 of file test_performance_monitor.cpp.
References make_query().

◆ TEST_F() [23/51]
| TEST_F | ( | PerformanceAlertTest | , |
| AllAlertTypes | ) |
Definition at line 509 of file test_performance_monitor.cpp.
References database::monitoring::performance_alert::type().
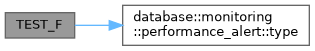
◆ TEST_F() [24/51]
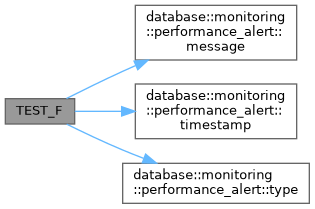
| TEST_F | ( | PerformanceAlertTest | , |
| ConstructionAndAccessors | ) |
Definition at line 497 of file test_performance_monitor.cpp.
References database::monitoring::performance_alert::message(), database::monitoring::performance_alert::timestamp(), and database::monitoring::performance_alert::type().
◆ TEST_F() [25/51]
| TEST_F | ( | PerformanceMonitorQueryTest | , |
| AvgQueryTimeCalculation | ) |
Definition at line 85 of file test_performance_monitor.cpp.
References make_query().

◆ TEST_F() [26/51]
| TEST_F | ( | PerformanceMonitorQueryTest | , |
| RecordAndRetrieveSingleQuery | ) |
Definition at line 59 of file test_performance_monitor.cpp.
References make_query().

◆ TEST_F() [27/51]
| TEST_F | ( | PerformanceMonitorQueryTest | , |
| RecordMultipleQueries | ) |
Definition at line 69 of file test_performance_monitor.cpp.
References make_query().

◆ TEST_F() [28/51]
| TEST_F | ( | PoolMetricsTest | , |
| AverageWaitTime | ) |
Definition at line 612 of file test_performance_monitor.cpp.
◆ TEST_F() [29/51]
| TEST_F | ( | PoolMetricsTest | , |
| AverageWaitTimeZeroWhenNoAcquisitions | ) |
Definition at line 620 of file test_performance_monitor.cpp.
◆ TEST_F() [30/51]
| TEST_F | ( | PoolMetricsTest | , |
| InitialStateIsZero | ) |
Definition at line 535 of file test_performance_monitor.cpp.
◆ TEST_F() [31/51]
| TEST_F | ( | PoolMetricsTest | , |
| RecordFailedAcquisition | ) |
Definition at line 555 of file test_performance_monitor.cpp.
◆ TEST_F() [32/51]
| TEST_F | ( | PoolMetricsTest | , |
| RecordHealthCheck | ) |
Definition at line 603 of file test_performance_monitor.cpp.
◆ TEST_F() [33/51]
| TEST_F | ( | PoolMetricsTest | , |
| RecordMultipleAcquisitionsTracksMinMax | ) |
Definition at line 563 of file test_performance_monitor.cpp.
◆ TEST_F() [34/51]
| TEST_F | ( | PoolMetricsTest | , |
| RecordSuccessfulAcquisition | ) |
Definition at line 544 of file test_performance_monitor.cpp.
◆ TEST_F() [35/51]
| TEST_F | ( | PoolMetricsTest | , |
| RecordTimeout | ) |
Definition at line 575 of file test_performance_monitor.cpp.
◆ TEST_F() [36/51]
| TEST_F | ( | PoolMetricsTest | , |
| ResetClearsStatistics | ) |
Definition at line 636 of file test_performance_monitor.cpp.
◆ TEST_F() [37/51]
| TEST_F | ( | PoolMetricsTest | , |
| SuccessRate | ) |
Definition at line 624 of file test_performance_monitor.cpp.
◆ TEST_F() [38/51]
| TEST_F | ( | PoolMetricsTest | , |
| SuccessRateNoAcquisitions | ) |
Definition at line 632 of file test_performance_monitor.cpp.
◆ TEST_F() [39/51]
| TEST_F | ( | PoolMetricsTest | , |
| UpdateActiveTracksPeak | ) |
Definition at line 582 of file test_performance_monitor.cpp.
◆ TEST_F() [40/51]
| TEST_F | ( | PoolMetricsTest | , |
| UpdateQueuedTracksPeak | ) |
Definition at line 592 of file test_performance_monitor.cpp.
◆ TEST_F() [41/51]
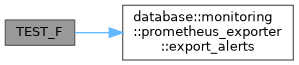
| TEST_F | ( | PrometheusExporterTest | , |
| ExportAlertsReturnsTrue | ) |
Definition at line 685 of file test_performance_monitor.cpp.
References database::monitoring::prometheus_exporter::export_alerts().
◆ TEST_F() [42/51]
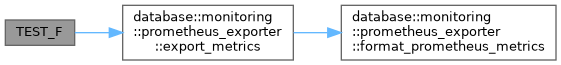
| TEST_F | ( | PrometheusExporterTest | , |
| ExportMetricsReturnsTrue | ) |
Definition at line 678 of file test_performance_monitor.cpp.
References database::monitoring::prometheus_exporter::export_metrics().
◆ TEST_F() [43/51]
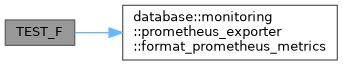
| TEST_F | ( | PrometheusExporterTest | , |
| FormatContainsMetricNames | ) |
Definition at line 663 of file test_performance_monitor.cpp.
References database::monitoring::performance_summary::active_connections, database::monitoring::performance_summary::avg_query_time, database::monitoring::performance_summary::error_rate, database::monitoring::prometheus_exporter::format_prometheus_metrics(), and database::monitoring::performance_summary::total_queries.
◆ TEST_F() [44/51]
| TEST_F | ( | QueryHistoryTest | , |
| GetRecentQueriesEmptyWindow | ) |
Definition at line 221 of file test_performance_monitor.cpp.
References make_query().

◆ TEST_F() [45/51]
| TEST_F | ( | QueryHistoryTest | , |
| GetRecentQueriesWithinWindow | ) |
Definition at line 211 of file test_performance_monitor.cpp.
References make_query().

◆ TEST_F() [46/51]
| TEST_F | ( | QueryHistoryTest | , |
| GetSlowQueriesAboveThreshold | ) |
Definition at line 233 of file test_performance_monitor.cpp.
References make_query().

◆ TEST_F() [47/51]
| TEST_F | ( | QueryHistoryTest | , |
| GetSlowQueriesNoneAboveThreshold | ) |
Definition at line 245 of file test_performance_monitor.cpp.
References make_query().

◆ TEST_F() [48/51]
| TEST_F | ( | QueryHistoryTest | , |
| GetSlowQueriesPreservesMetadata | ) |
Definition at line 253 of file test_performance_monitor.cpp.
References ASSERT_EQ, make_query(), and database::success.

◆ TEST_F() [49/51]
| TEST_F | ( | QueryTimerTest | , |
| DestructorRecordsMetrics | ) |
Definition at line 708 of file test_performance_monitor.cpp.
◆ TEST_F() [50/51]
| TEST_F | ( | QueryTimerTest | , |
| SetErrorMarksFailure | ) |
Definition at line 719 of file test_performance_monitor.cpp.
References database::monitoring::query_timer::set_error().
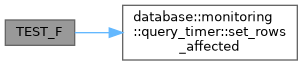
◆ TEST_F() [51/51]
| TEST_F | ( | QueryTimerTest | , |
| SetRowsAffected | ) |
Definition at line 730 of file test_performance_monitor.cpp.
References ASSERT_EQ, and database::monitoring::query_timer::set_rows_affected().